Code coverage of manual or automated tests with JaCoCo
Code coverage is a way to check what part of the code your tests are exercising. JaCoCo is a free code coverage library for Java.
Code coverage
There are two main streamlines in code coverage. One is running code coverage on each build measuring unit tests coverage. Once configured this needs no manual intervention. Depending on the tools there is even an option to fail the build if code coverage doesn't reach the desired threshold. This is well described in Automated code coverage of unit tests with Maven and JaCoCo post. Another aspect is running code coverage on automated or even manual functional tests scenarios. This post is dedicated to latter. I have already created What about code coverage post to the theory of this type of code coverage. Current post is about getting it done in practice.The idea
The idea is pretty simple. The application is started with a code coverage tool is attached to it, then tests are executed and results are gathered. This is it. Having stated it that way it doesn't sound that bizarre to run code coverage on manual tests. Running it makes sense if only tests are well documented and repeatable scenarios that are usually run on regression testing.JaCoCo Java agent
Java agent is powerful mechanism providing the ability to instrument and change classes at runtime. Java agent library is passed as a JVM parameter when running given application with -javaagent:{path_to_jar}. JaCoCo tool is implemented as Java agent. More details for Java agents can be found at java.lang.instrument package.In case application under test does not support plugin agents to JVM then coverage can be measured with offline instrumentation described in Code coverage with JaCoCo offline instrumentation with Maven post.
Restrictions
Some restrictions that have to be taken into consideration:- JaCoCo plugin is only for Eclipse IDE, hence it should be used in order to get the report
- Imported execution data must be based on the exact same class files that are also used within the Eclipse IDE, hence application should be run in Eclipse, it is not possible to build it and run it separately as class files will differ
- Eclipse is not capable of shutting down the JVM, it directly kills it, hence the only way to get results is to start JaCoCo agent in tcpserver output mode
- JaCoCo agent version 0.7.4 and Eclipse EclEmma plugin 2.3.2 are used, those are compatible, 0.7.5 introduces change in data format
Install Eclipse plugin
Having stated the restriction it is time to start. Installation is done through Eclipse -> Help -> Eclipse Marketplace... -> search for "jacoco" -> Install -> restart Eclipse.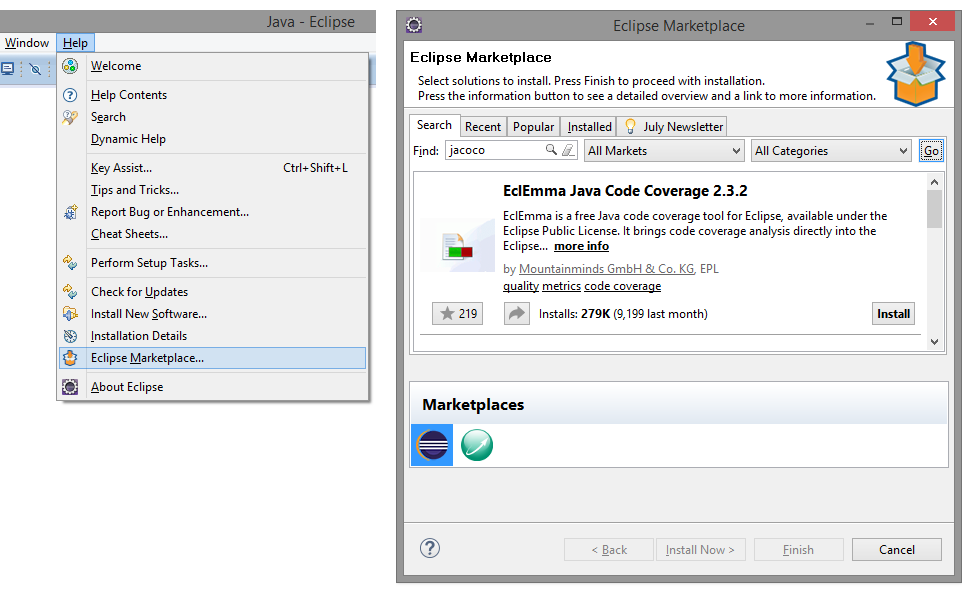
Run the application
As stated in restrictions in order code coverage to work application should be started in Eclipse. I will use sample application I have introduced in Build a RESTful stub server with Dropwizard post. It can be found in GitHub sample-dropwizard-rest-stub repository. For this tutorial, it is checked out to: C:\sample-dropwizard-rest-stub.Download JaCoCo 0.7.4 agent jar. For this tutorial it is saved to C:\JaCoCo
Project have to imported to Eclipse from File -> Import -> Existing Maven projects. Once imported Run configuration have to be done from Run -> Run Configurations… -> double click Java Application. This opens new window to define configuration. Properties are stated below:
- Name (Main tab): RestStubApp (could be whatever name)
- Project (Main tab): sample-dropwizard-rest-stub
- Main class (Main tab): com.automationrhapsody.reststub.RestStubApp
- Program arguments (Arguments tab): server config.yml
- VM arguments (Arguments tab): -javaagent:C:\JaCoCo\jacocoagent.jar=output=tcpserver (started in "tcpserver" output mode)
- Working directory -> Other (Arguments tab): C:\sample-dropwizard-rest-stub
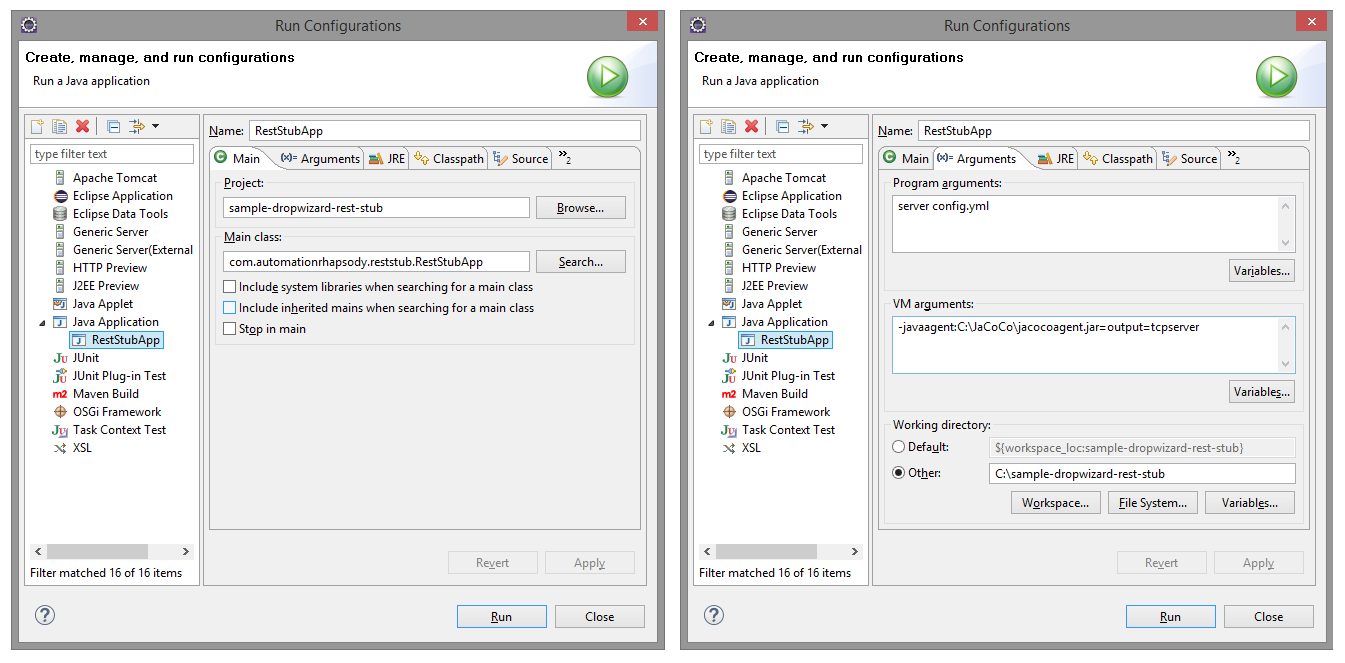
Once the configuration is created then run it.
Apart from the given sample application, it should be possible to run every application in Eclipse. This assumption is made on the fact that developers do need to debug their application, so they will have a way to run it. The important part is to include -javaagent: part in VM arguments section
Test
Now when we have the application running is time to run all tests we have both automation and manual. For manual, it is important to be documented scenario which is reproducible in each regression testing, not just some random clicking. The idea is that we want to measure what coverage our tests do.Import coverage results
After all tests have passed it is time to import the results into Eclipse. This is done from File -> Import -> Coverage Session -> select Agent address radio button but leave defaults -> enter some name and select code under test.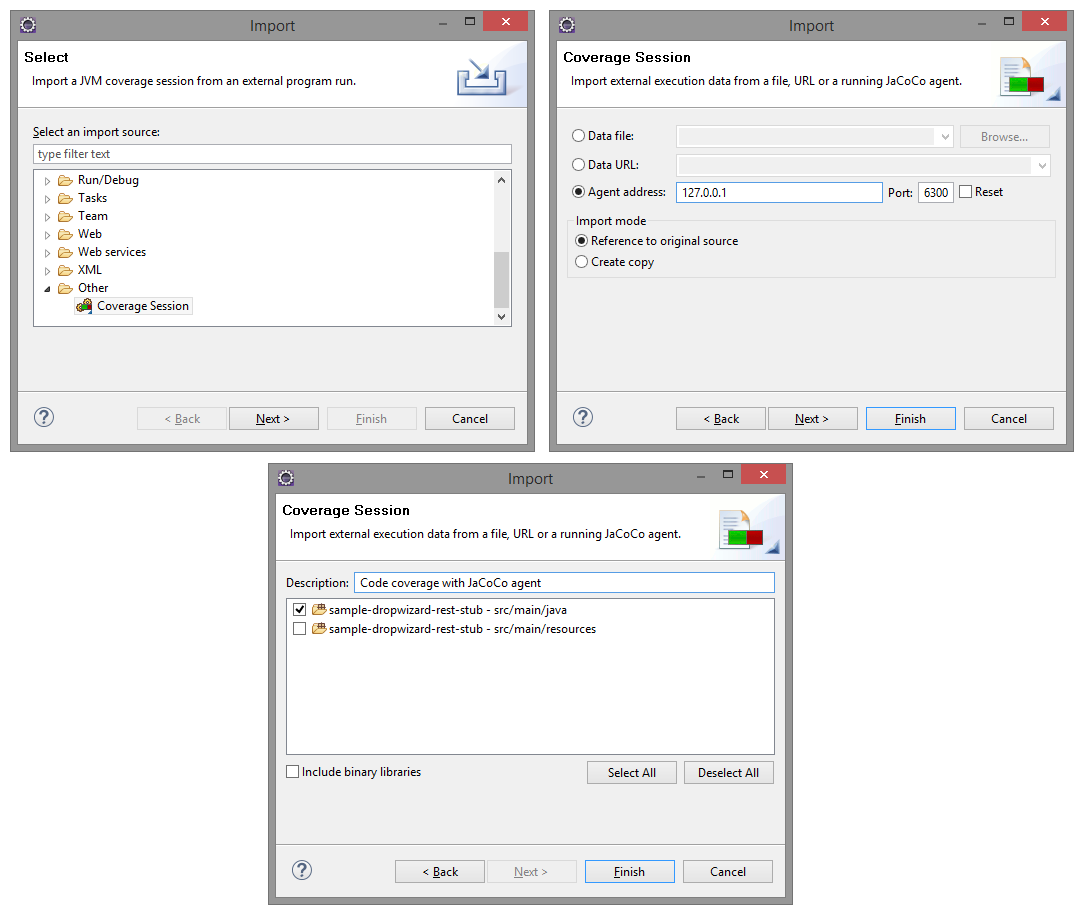
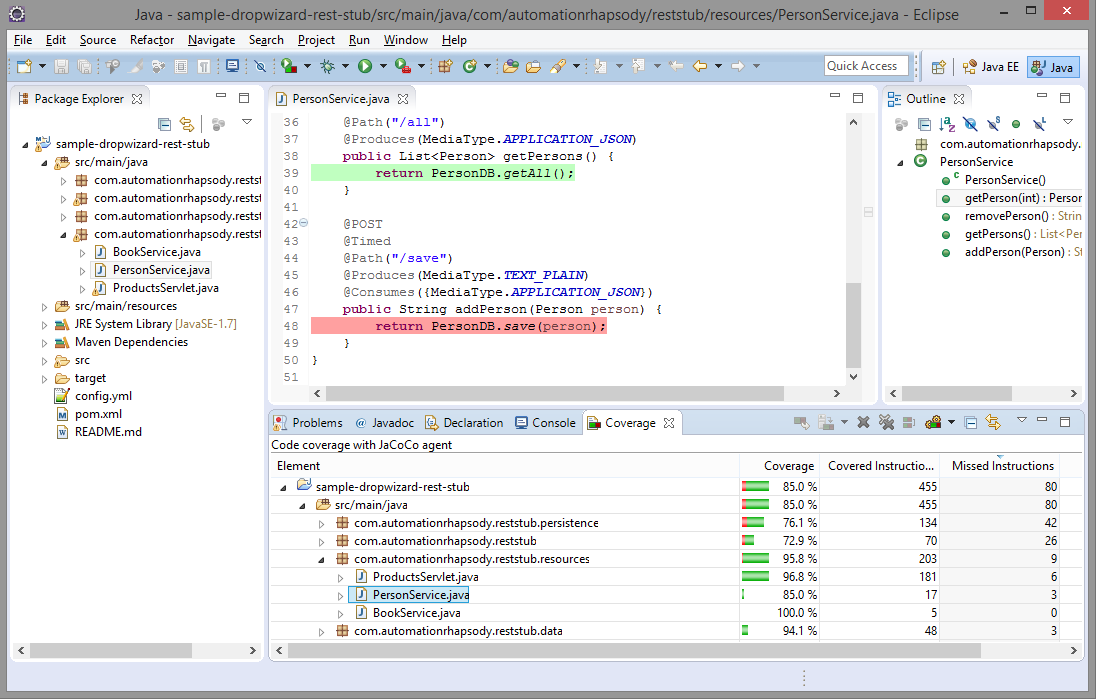
Once imported results can be seen and code gets highlighted.
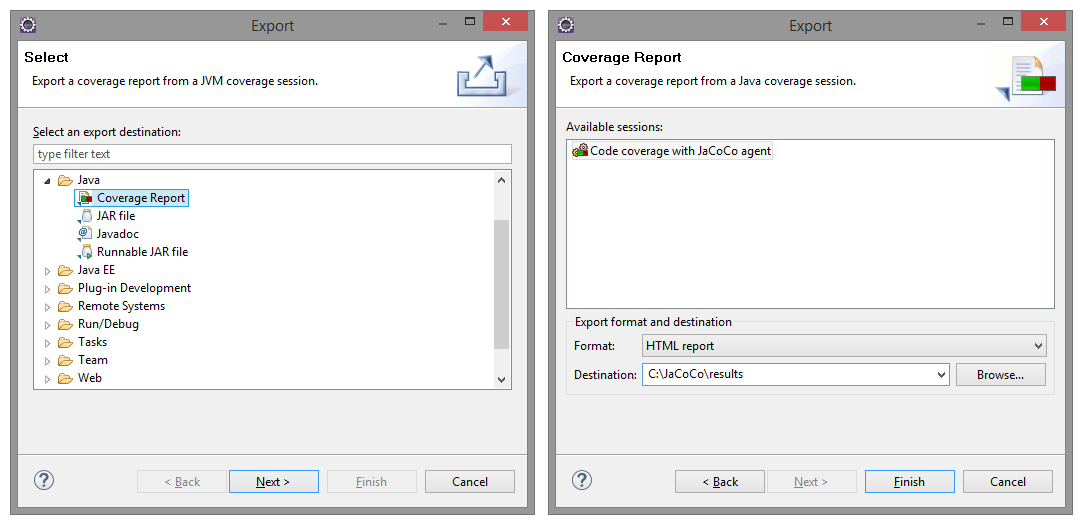
Export to HTML
Now result can be exported. There are several options: HTML, zipped HTML, XML, CSV or JaCoCo execution data file. Export is done from: File -> Export -> Coverage Report -> select session and location.