Distributed system observability: extract and visualize metrics from OpenTelemetry spans

Last Updated on by

Post summary: How to extract metrics from spans by OpenTelementry collector, store them in Prometheus and properly visualize them in Grafana.

This post is part of Distributed system observability: complete end-to-end example series. The code used for this series of blog posts is located in selenium-observability-java GitHub repository.

Prometheus and metrics

Prometheus is an open-source monitoring and alerting toolkit. Prometheus collects and stores its metrics. Metrics information is stored with the timestamp at which it was recorded, alongside optional key-value pairs called labels. Metric is a way to measure something, e.g. how many people had read the current article. Metrics change over time, and Prometheus is recording and graphically visualizing the change over time.

Extract metrics from spans in OpenTelementry Collector

OpenTelemetry collector receives tracing data from the frontend, converts it into Jaeger format, and exports it to the Jaeger backend. Every span has duration, which is a metric. In order to extract the metric, the Span Metrics Processor contributors library is used. Full configurations are in otel-config.yaml. In the file are configured receivers, processors, exporters, and service, There are two receivers: oltp is receiving the traces; otlp/spanmetrics is a dummy receiver, that is never used, but the pipeline requires one to be present. There are two processors: batch compresses the data into batches and optimizes data transmission; spanmetrics extracts the metrics from spans. Spanmetrics configuration should have metrics_exporter, prometheus in the current case, which is existing in the exporters section of the configuration. An optional configuration is latency_histogram_buckets, which defines the histogram buckets. This is a very important concept and will be explained later. There are two exporters: jaeger sends the data to Jaeger backend; prometheus defines an endpoint, which Prometheus can fetch the metrics from, 0.0.0.0:8889 in the current example. Port 8889 also has to be exposed in docker-compose.yml file. The service section is used to configure what components are enabled. In the current example, otlp receiver takes the traces and exports them to jaeger, also traces are being processed by spanmetrics processor and exported as metrics to prometheus endpoint. More details can be found in OpenTelemetry Collector configuration.

receivers:
  otlp:
    protocols:
      grpc:
      http:
  otlp/spanmetrics:
    protocols:
      grpc:
        endpoint: 0.0.0.0:12346

processors:
  batch:
  spanmetrics:
    metrics_exporter: prometheus
    latency_histogram_buckets:
      [200ms, 400ms, 800ms, 1s, 1200ms, 1400ms, 1600ms, 1800ms, 2s, 5s, 7s]

exporters:
  jaeger:
    endpoint: jaeger:14250
    tls:
      insecure: true
  prometheus:
    endpoint: 0.0.0.0:8889
    metric_expiration: 1440m

service:
  pipelines:
    traces:
      receivers: [otlp]
      processors: [spanmetrics, batch]
      exporters: [jaeger]
    metrics:
      receivers: [otlp/spanmetrics]
      exporters: [prometheus]

Prometheus histogram by OpenTelemetry Collector

A Prometheus histogram collects metrics and counts them in configurable buckets. It also provides a sum of all observed values. Buckets are separate measurable dimensions that metrics are put into. In the current example, the buckets are [200ms, 400ms, 800ms, 1s, 1200ms, 1400ms, 1600ms, 1800ms, 2s, 5s, 7s]. Spans that are being received by the frontend are compared by their duration and put into a separate metric bucket. The easiest way to illustrate this is with an example. If a request takes 1.29 seconds, then buckets from 200ms to 1200ms are untouched, all other buckets from 1400ms to 7s are increased with a value of 1. When the next request comes with a duration of 1.99 seconds, then buckets from 200ms to 1800ms are untouched, buckets from 2s to 7s are increased with a value of 1. This is hard to understand but is a very important concept. You can experiment by running the examples, then open the frontend at http://localhost:3000/, and click the “Fetch persons” button. Observe the metrics buckets at OpenTelemetry Collector http://localhost:8889/metrics. The metrics of the two example requests above are visialized in the screenshot below. Buckets are with name latency_bucket and additional labels to identify the correct span. The span name is set into the operation label in the bucket. In the current example, “GET /api/person-service/persons” span is used. Along with the configured buckets, there are two additional buckets – 9.223372036854775e+12 – I truly do not what that is, and +Inf – this is the default bucket for all requests which does not fit the predefined buckets, i.e. longer than 7 seconds. There are two more counters – latency_sum – the total time in milliseconds that all the requests took, in our case – 1.29s + 1.99s = 3279ms; latency_count – the total number of requests, in our case – 2.

Visualize in Grafana

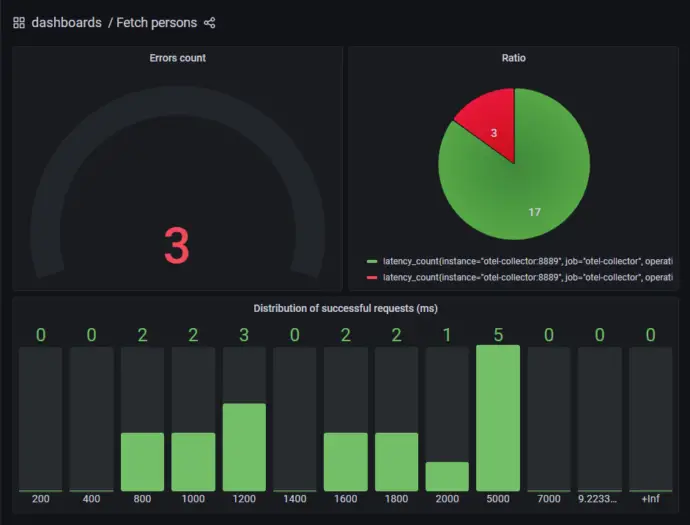
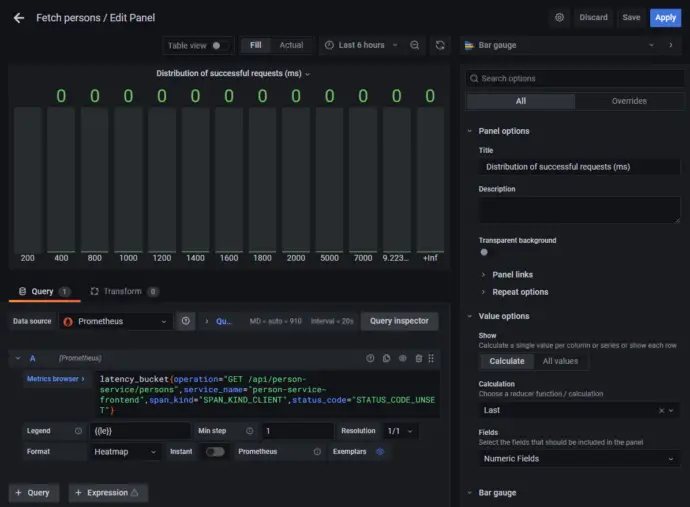
The two requests listed above are visualized in Grafana as shown below, one request is in the 1400ms (1200ms-1400ms) bucket, one request is in the 2000ms (1800ms-2000ms) bucket.

The panel above is defined in Grafana. It is a Bar gauge, the data source is Prometheus, Metric browser is latency_bucket{operation=”GET /api/person-service/persons”,service_name=”person-service-frontend”,span_kind=”SPAN_KIND_CLIENT”,status_code=”STATUS_CODE_UNSET”}, Legend is {{le}}, Min step is 1, Format is Heatmap.

Working with histogram buckets is a complex task, How to visualize Prometheus histograms in Grafana post gives good guidance.

A custom dashboard is created in the examples, it is accessible at http://localhost:3001/d/bgZ6Mf5nk/fetch-persons?orgId=1. The dashboard is defined in etc/grafana-custom-dashboard.json file.

Conclusion

In the current post, I have shown how to make OpenTelemetry Collector convert the spans into metrics, which can be fetched by Prometheus and visualized in Grafana.

Related Posts

Read more...

Distributed system observability: complete end-to-end example with OpenTracing, Jaeger, Prometheus, Grafana, Spring Boot, React and Selenium

Last Updated on by

Post summary: Code examples and explanations on an end-to-end example showcasing a distributed system observability from the Selenium tests through React front end, all the way to the database calls of a Spring Boot application. Examples are implemented with the OpenTracing toolset and traces are saved in Jaeger. This example also shows a complete observability setup including tools like Grafana, Prometheus, Loki, and Promtail.

This post is part of Distributed system observability: complete end-to-end example series. The code used for this series of blog posts is located in selenium-observability-java GitHub repository.

Introduction

Nowadays, the MIcroservices architecture is very popular. It certainly has its benefits, allowing the companies to deliver faster products to the market. It is much easier to manage several small applications, each one of them with isolated responsibilities, rather than one big fat monolithic application. Microservices architecture has its challenges as well. One of those challenges is traceability. What happens in case of error, where did it occur, what microservices were involved, what were the requests flow through the system, where is the stack trace? In a monolithic application, the stack trace is shown into the logs, giving the exact location of the error. In a microservices landscape, errors are in many cases meaningless, unless there is full traceability of the request flow.

Observability and distributed tracing

Distributed tracing, also called distributed request tracing, is a method used to profile and monitor applications, especially those built using a microservices architecture. Distributed tracing helps pinpoint where failures occur and what causes poor performance. Logs, metrics, and traces are often known as the three pillars of observability. Further reading on observability can be done in The Three Pillars of Observability article.

OpenTracing

OpenTracing is an API specification and libraries, that enables the instrumentation of distributed applications. It is not locked to any particular vendors and allows flexibility just by changing the configuration of already instrumented applications. More details can be found in Instrumenting your application and What is Distributed Tracing?. Current examples are based on OpenTracing libraries and tools.

End-to-end traceability and observability

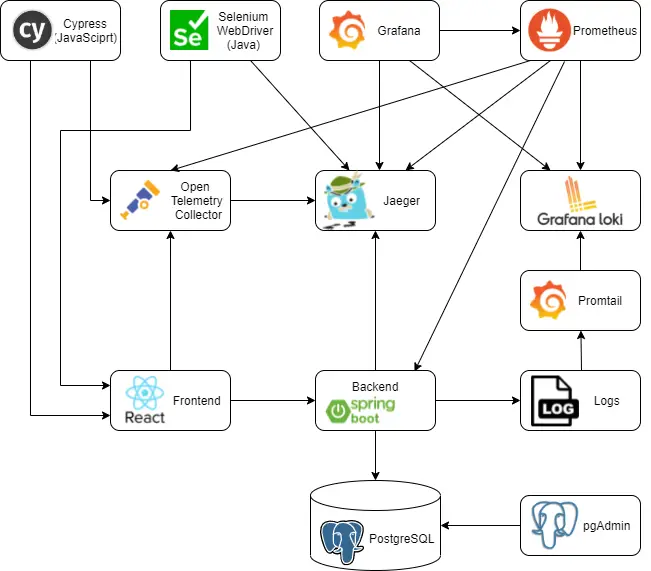
In the current examples, I am going to give an end-to-end solution, how observability can be achieved in a distributed system. I have used mnadeem/boot-opentelemetry-tempo project as a basis and have extended it with React Frontend and Selenium tests, to provide a complete end-to-end example. Below is a diagram of the full setup. All applications involved will be explained on a higher level.

PostgreSQL and pgAdmin

The basic examples used PostgreSQL, I thought of changing it to MySQL, but when I did short research, I found that PostgreSQL has some advantages. PostgreSQL is an object-relational database, while MySQL is a purely relational database. This means that Postgres includes features like table inheritance and function overloading, which can be important to certain applications. Postgres also adheres more closely to SQL standards. See more in MySQL vs PostgreSQL — Choose the Right Database for Your Project.

pgAdmin is the default user interface to manage a PostgreSQL database, so it is present in the architecture as well.

Spring Boot backend

Spring Boot is used as a backend. I did want to get some exposure to the technology, so I created a very basic application in Spring Boot. It uses the PostgreSQL database for reading and writing data. Spring Boot application is instrumented with OpenTelemetry Java library and exports the traces in Jaeger format directly to the Jaeger backend. It also writes application log files on a file system. Backend exposes APIs, which are consumed by the frontend. More details on the backend can be found in Distributed system observability: Instrument Spring Boot application with OpenTelemetry post.

React frontend

I am very experienced with React, so this was the natural choice for the frontend technology. The frontend uses fetch() to consume the backend APIs. It is instrumented with OpenTelementry JavaScript libraries to trace all communication happening through fetch() and to exports the traces in OpenTelemetry format to the OpenTelemetry collector. The frontend also has manual instrumentation which traces the actions done by end-users on it. More details on the frontend can be found in Distributed system observability: Instrument React application with OpenTelemetry post.

OpenTelemetry collector

OpenTelemetry collector converts the data received from the frontend in OpenTelemetry format into Jaeger format and exports it to the Jaeger backend. The collector is also extracting the span metrics, which are read by Prometheus, read more in Distributed system observability: extract and visualize metrics from OpenTelemetry spans post. Configurations are described in the collector configuration. Local configurations are in otel-config.yaml.

Selenium tests

Selenium was chosen for the web testing framework because of its observability feature. Actually, this was the reason for which I created the current examples. After getting to know the tracing features of Selenium better, I find them not much useful. Selenium does not provide traceability of the tests, but rather on its internal operations and performance. Having started with the tracing and the whole project, I could not ditch it in the middle, so I have to create a custom way to make Selenium trace the tests. Selenium tests export tracing information in Jaeger format directly into the Jaeger backend. More details on the tests can be found in Distributed system observability: Instrument Selenium tests with OpenTelemetry post.

Cypress tests

Cypress is a front-end testing tool built for the modern web. It is most often compared to Selenium. The initial driver of the current post series was Selenium observability. After I got a better understanding of the observability topic, I’ve decided to add examples on Cypress tests observability for more completeness of the examples. Cypress interacts with the Frontend and exports its traces to OpenTelemetry Collector, which then forwards the traces into Jaeger. More details on the tests can be found in Distributed system observability: Instrument Cypress tests with OpenTelemetry post.

Jaeger

Jaeger, inspired by Dapper and OpenZipkin, is an open-source distributed tracing system. It is used for monitoring and troubleshooting microservices-based distributed systems. Jaeger collects all the traces and provides a search and visualization of the traces. In the original examples, Grafana Tempo was used as a backend and Jaeger UI via the jaeger-query module to open the traces. I initially started with it, but Tempo does not provide a possibility to search the traces. I find this rather inconvenient, so I switched completely to Jaeger.

Promtail

Promtail is an agent which ships the contents of the Spring Boot backend logs to a Loki instance. It is usually deployed to every machine that has applications needed to be monitored. Local configurations are in promtail-local.yaml.

Loki

Grafana Loki is a log aggregation system inspired by Prometheus. It does not index the contents of the logs, but rather a set of labels for each log stream. Log data itself is then compressed and stored in chunks. In the current example, logs are being pushed to Loki by Promtrail. Local configurations are in loki-local.yaml.

Prometheus

Prometheus is an open-source monitoring and alerting toolkit. Prometheus collects and stores its metrics as time-series data, i.e. metrics information is stored with the timestamp at which it was recorded, alongside optional key-value pairs called labels. In the current example, Prometheus is monitoring the Sprint Boot backend, Loki, Jaeger, and OpenTelemetry Collector. It pulls the metrics data from those applications at a regular interval and stores them in its database. Alerts can be configured based on the metrics. Local configurations are in prometheus.yaml.

Grafana

Grafana is an open-source solution for running data analytics, pulling up metrics from different data sources, and monitoring applications with the help of customizable dashboards. The tool helps to study, analyze and monitor data over a period of time, technically called time-series analytics. In the current example, Grafana pulls data from Prometheus, Jaeger, and Loki. Local configurations are in grafana-dashboards.yaml and grafana-datasource.yml.

Explore the example

Running the example is very easy. What is needed is Docker compose and IDE that can run JUnit tests, I prefer IntelliJ IDEA. Run the examples:

  1. Check out the source code from https://github.com/llatinov/selenium-observability-java
  2. Run: docker-compose build
  3. Run: docker-compose up
  4. Open selenium-tests Maven project and run all the unit tests

Explore the example artifacts:

pgAdmin

pgAdmin is accessible at http://localhost:8005/. In order to log in, use the following credentials: pgadmin4@pgadmin.org / admin. This is needed only if the database records have to be read or modified.

Jaeger

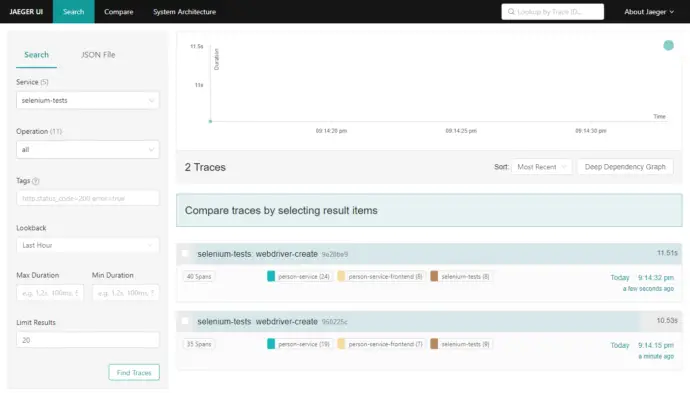
Jaeger is accessible at http://localhost:16686. The home page shows rich search functionality. There is a dropdown with all available services, then operations performed by the selected service can be also filtered.

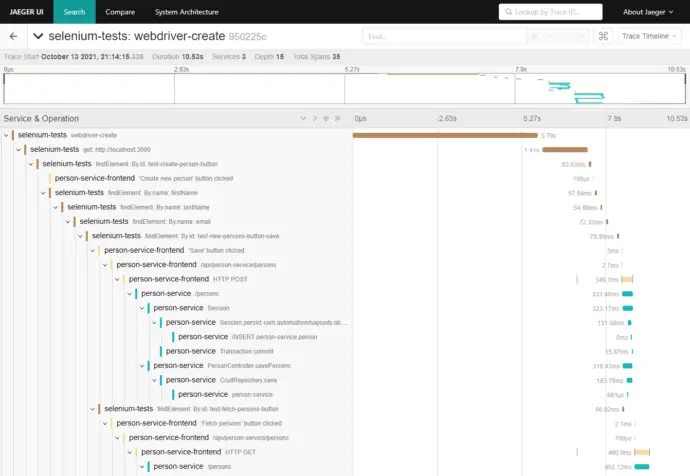
A trace can be opened from the search results. It shows all the actions for this trace that have been recorded.

Grafana

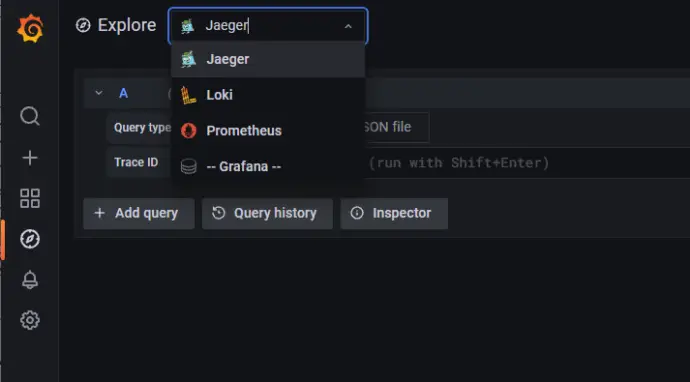
Grafana is accessible at http://localhost:3001. Different data sources can be accessed from the left-hand side menu, there is a small compass, the Explore menu. From the top, there is a dropdown with the available data sources.

Grafana -> Loki

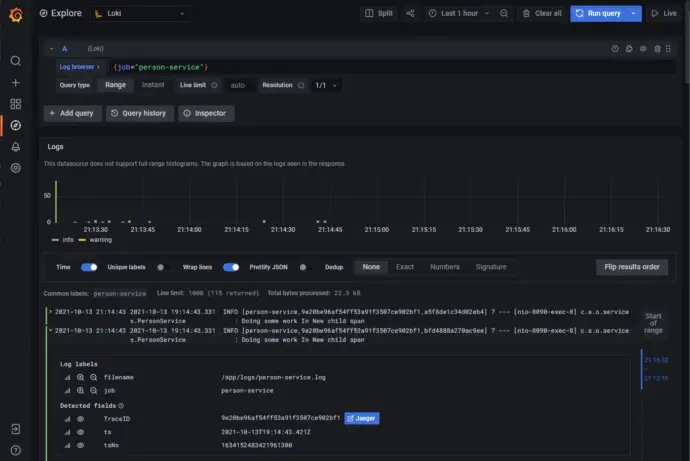
From Grafana select Loki as datasource. Search for {job=”person-service”}, this shows all logs for the Spring Boot backend.

Grafana -> Jaeger

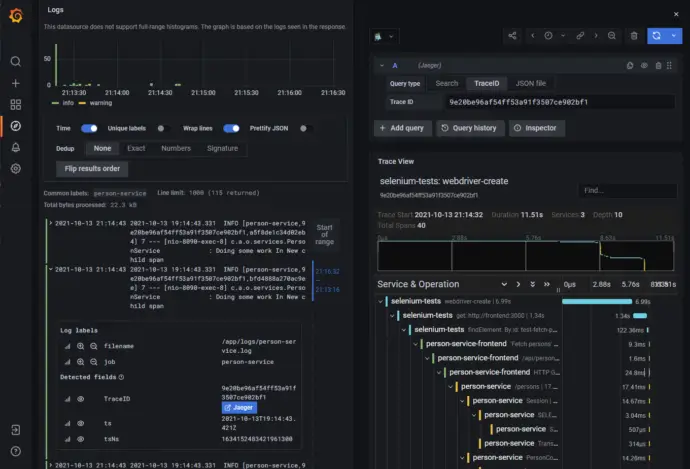
Jaeger data source can open a trace by its id. This data source can be used in conjunction with Loki. Search logs in Loki, then open a log, this exposes a Jaeger button.

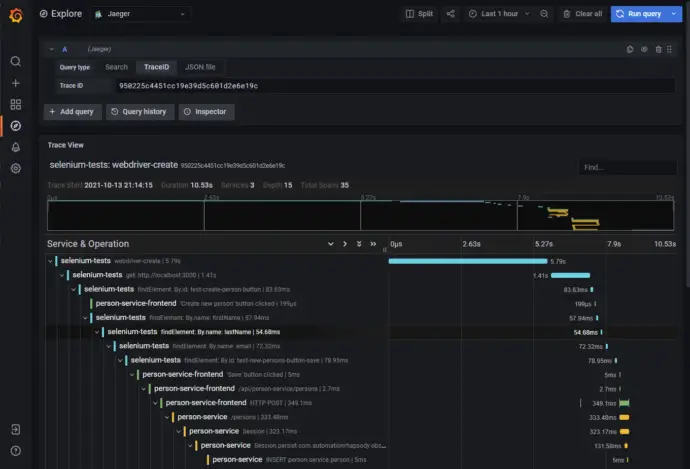
Jaeger data source can be opened directly from the dropdown, then type the TraceID.

Grafana -> Prometheus

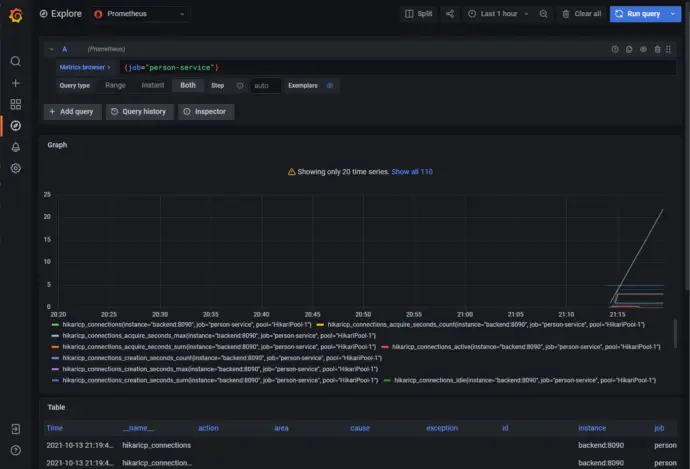
From Grafana select Prometheus as a data source. Search for {job=”person-service”}, this shows all metrics for the Spring Boot backend.

Prometheus

Prometheus is accessible at http://localhost:9090/. Search for {job=”person-service”}, this shows all metrics for the Spring Boot backend.

Furter posts with details

This is an introductory post, more details, explanations, and code examples on actual implementation can be found in the following posts:

Conclusion

Microservices architecture is used more often. Alongside its advantages, it comes with specific challenges. Observability is one of those challenges and is a very important topic in a distributed software system. In the current example, I have shown end-to-end observability achieved with popular open-source tools. The main objective of my experiments was to be able to trace Selenium test execution through all the systems involved in the distributed architecture.

Related Posts

Read more...