Post summary: Instrumenting a Spring Boot Java application with OpenTelemetry.
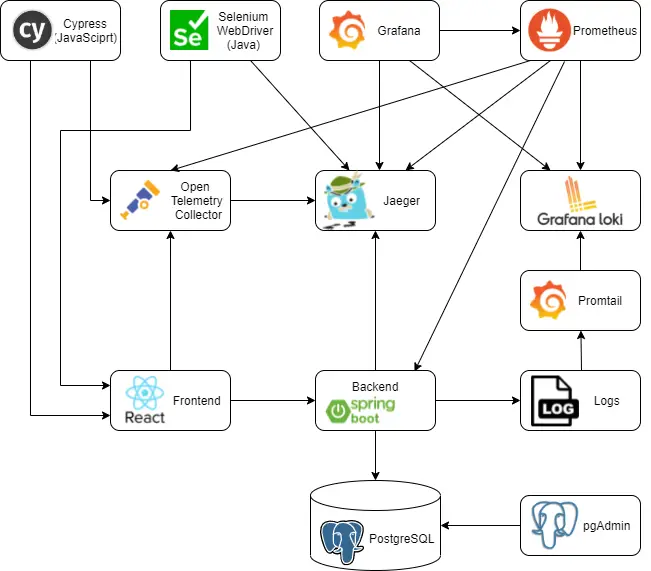
This post is part of Distributed system observability: complete end-to-end example series. The code used for this series of blog posts is located in selenium-observability-java GitHub repository.
Spring Boot
Spring Boot makes it easy to create stand-alone, production-grade Spring-based Applications that you can “just run”. Most Spring Boot applications need minimal Spring configuration. Creating a basic Spring Boot application takes a few steps.
Application
The application class is the entry point. It should have @SpringBootApplication annotation. I have added additional @ServletComponentScan annotation in order to register a custom response filter. I want to output the TraceId as a response header.
Application
import org.springframework.boot.SpringApplication;
import org.springframework.boot.autoconfigure.SpringBootApplication;
import org.springframework.boot.web.servlet.ServletComponentScan;

@ServletComponentScan
@SpringBootApplication
public class PersonServiceApplication {

    public static void main(String[] args) {
        SpringApplication.run(PersonServiceApplication.class, args);
    }
}
Filter
import io.opentelemetry.api.trace.Span;

import javax.servlet.*;
import javax.servlet.annotation.WebFilter;
import javax.servlet.http.HttpServletResponse;
import java.io.IOException;

@WebFilter("*")
public class AddResponseHeaderFilter implements Filter {

    @Override
    public void doFilter(ServletRequest request, ServletResponse response, FilterChain chain) throws IOException, ServletException {
        HttpServletResponse httpServletResponse = (HttpServletResponse) response;
        httpServletResponse.setHeader("x-trace-id", Span.current().getSpanContext().getTraceId());
        chain.doFilter(request, response);
    }
}
Controller
In the current example, there is only one controller with two APIs, a POST and GET endpoints with the same path. The class has to be annotated with @RestController. Each API endpoint is annotated with @RequestMapping, with more details about the path and the method. I have used Spring’s constructor-based dependency injection. I have omitted the @Autowired annotation because there is just one constructor.
import com.automationrhapsody.observability.services.PersonService;
import org.slf4j.Logger;
import org.slf4j.LoggerFactory;
import org.springframework.web.bind.annotation.RequestBody;
import org.springframework.web.bind.annotation.RequestMapping;
import org.springframework.web.bind.annotation.RequestMethod;
import org.springframework.web.bind.annotation.RestController;

import java.util.List;

@RestController
public class PersonController {

    private static final Logger LOGGER
            = LoggerFactory.getLogger(PersonController.class);

    private PersonService personService;

    public PersonController(PersonService personService) {
        this.personService = personService;
    }

    @RequestMapping(value = "/persons", method = RequestMethod.GET)
    public List<PersonDto> getPersons() {
        LOGGER.info("Processing GET /persons request.");

        List<PersonDto> persons = personService.getPersons();
        return persons;
    }

    @RequestMapping(value = "/persons", method = RequestMethod.POST)
    public Long savePersons(@RequestBody PersonDto person) {
        LOGGER.info("Processing POST /persons request with {}", person);

        Long resultId = personService.savePerson(person);
        return resultId;
    }
}
Repository
Defining a very basic repository can be really easy with Spring, all needed is to extend the CrudRepository interface. If fine-tuning and custom methods are needed then it is needed to create an interface that extends the Spring’s Repository interface and defines custom repository methods inside. Read more in Working with Spring Data Repositories.
import org.springframework.data.repository.CrudRepository;
import org.springframework.stereotype.Repository;

@Repository
public interface FlightRepository extends CrudRepository<PersonEntity, Long> {
}
Service
A service layer is a good idea to handle the business logic between the controller and the repository. In this case, dependency is injected with @Autowired annotation. findAll() is a method that comes from CrudRepository interface. It gets the data from the database. @WithSpan annotation creates a new span in the OpenTelemetry traces. This will be explained in more detail.
import com.automationrhapsody.observability.controllers.PersonDto;
import com.automationrhapsody.observability.repositories.person.FlightRepository;
import com.automationrhapsody.observability.repositories.person.PersonEntity;
import io.opentelemetry.api.common.AttributeKey;
import io.opentelemetry.api.common.Attributes;
import io.opentelemetry.api.trace.Span;
import io.opentelemetry.extension.annotations.WithSpan;
import org.slf4j.Logger;
import org.slf4j.LoggerFactory;
import org.springframework.beans.factory.annotation.Autowired;
import org.springframework.stereotype.Service;

import java.util.List;
import java.util.stream.Collectors;
import java.util.stream.StreamSupport;

@Service
public class PersonService {

    private static final Logger LOGGER =
            LoggerFactory.getLogger(PersonService.class);

    @Autowired
    private FlightRepository flightRepository;

    public List<PersonDto> getPersons() {
        doSomeWorkNewChildSpan();
        Iterable<PersonEntity> persons = flightRepository.findAll();
        return StreamSupport.stream(persons.spliterator(), false)
                .map(this::toPersonDto)
                .collect(Collectors.toList());
    }

    @WithSpan
    public void doSomeWorkNewChildSpan() {
        LOGGER.info("Doing some work In New child span");
        Span span = Span.current();
        span.setAttribute("template.a2", "some value");
        span.addEvent("template.processing2.start", attributes("321"));
        span.addEvent("template.processing2.end", attributes("321"));
    }

    private Attributes attributes(String id) {
        return Attributes.of(AttributeKey.stringKey("app.id"), id);
    }

    private PersonDto toPersonDto(PersonEntity person) {
        PersonDto personDto = new PersonDto();
        personDto.setFirstName(person.getFirstName());
        personDto.setLastName(person.getLastName());
        personDto.setEmail(person.getEmail());
        return personDto;
    }
}
Instrumentation
OpenTelemetry provides a way for manual instrumentation, which will be covered in the subsequent Selenium-based post. OpenTelemetry also provides a Java agent JAR, that can be attached to any Java 8+ application and dynamically injects bytecode to capture telemetry from a number of popular libraries and frameworks. This JAR agent is attached to the Spring Boot application described above. This is done in the Docker file. Jaeger exporter and Jaeger backend endpoint are configured with otel.traces.exporter and otel.exporter.jaeger.endpoint environment variables.
# ========= BUILD =========
FROM maven:3-openjdk-11 as builder
WORKDIR /build

COPY pom.xml pom.xml
RUN mvn dependency:resolve

COPY . .
RUN mvn install

# ========= RUN =========
FROM openjdk:11
ENV APP_NAME person-service
# https://github.com/open-telemetry/opentelemetry-java-instrumentation
ENV JAVA_OPTS "$JAVA_OPTS \
  -Dotel.traces.exporter=jaeger \
  -Dotel.exporter.jaeger.endpoint=http://jaeger:14250 \
  -Dotel.metrics.exporter=none \
  -Dotel.resource.attributes="service.name=${APP_NAME}" \
  -Dotel.javaagent.debug=false \
  -javaagent:/app/opentelemetry-javaagent-all.jar"

ADD https://github.com/open-telemetry/opentelemetry-java-instrumentation/releases/download/v1.6.2/opentelemetry-javaagent-all.jar /app/opentelemetry-javaagent-all.jar
COPY --from=builder /build/target/$APP_NAME-*.jar /app/$APP_NAME.jar

CMD java $JAVA_OPTS -jar /app/$APP_NAME.jar
This is it. Just by attaching the Java agent application is instrumented and OpenTelemetry is ready to report traces. OpenTelemetry supports a large number of libraries and frameworks, the full list can be found in Supported libraries, frameworks, application servers, and JVMs.
Custom tracking
In many cases, apart from the standard tracing, the application has to report additional traces. This can be very easily done with the @WithSpan annotation. This annotation marks that the execution of this method or constructor should result in a new Span. It can be used to signal OpenTelemetry auto-instrumentation that a new span should be created whenever a marked method is executed. In the example above, a custom attribute has been added to the new Span. This is not mandatory though, just adding the annotation will record the method invocation as a new span in the trace output.
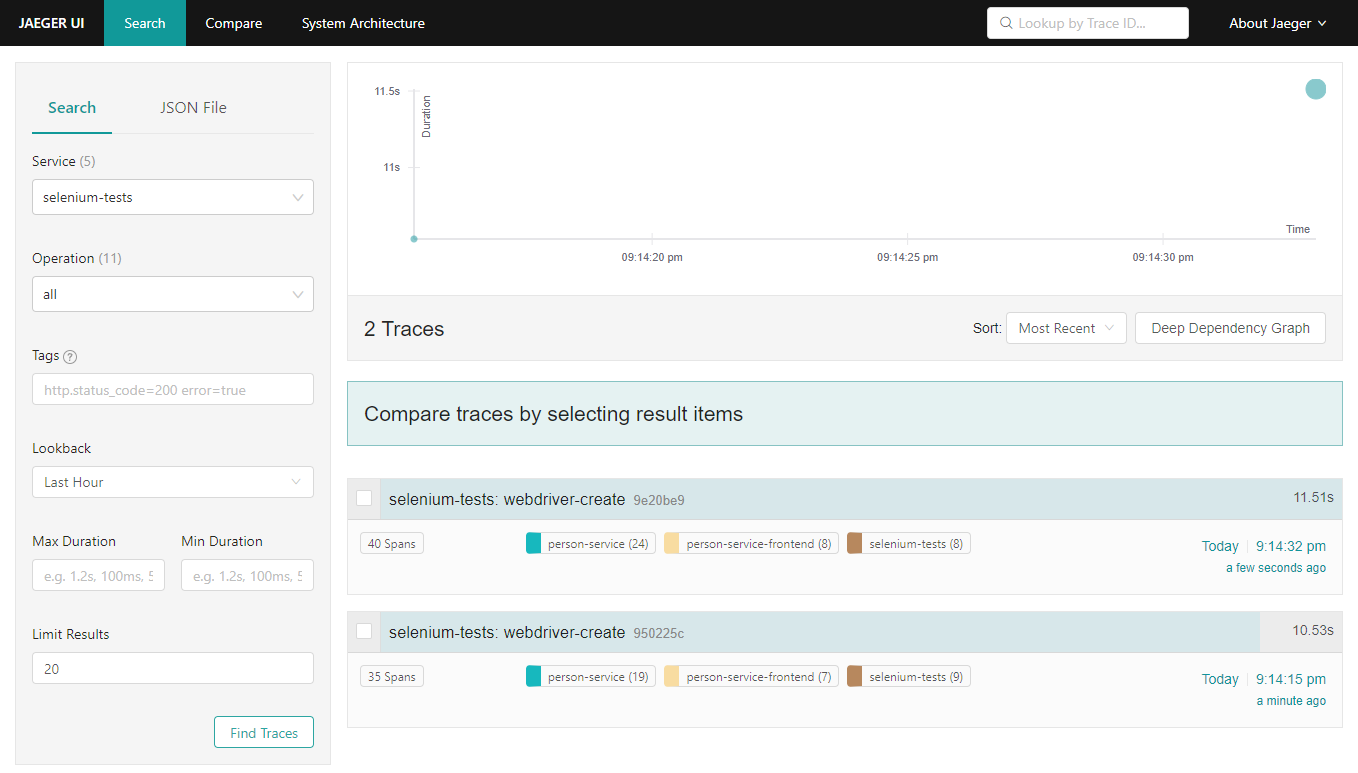
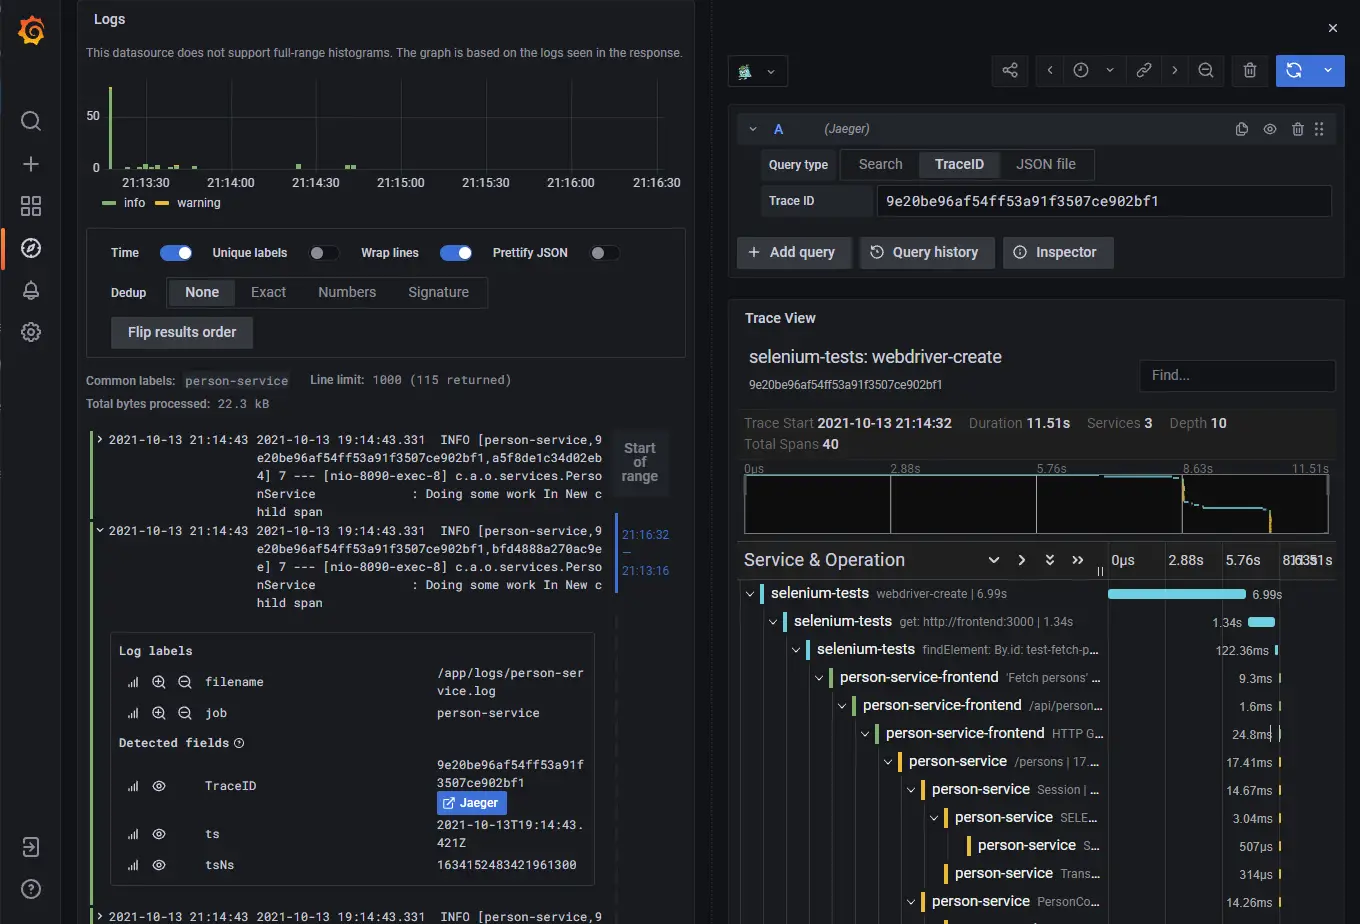
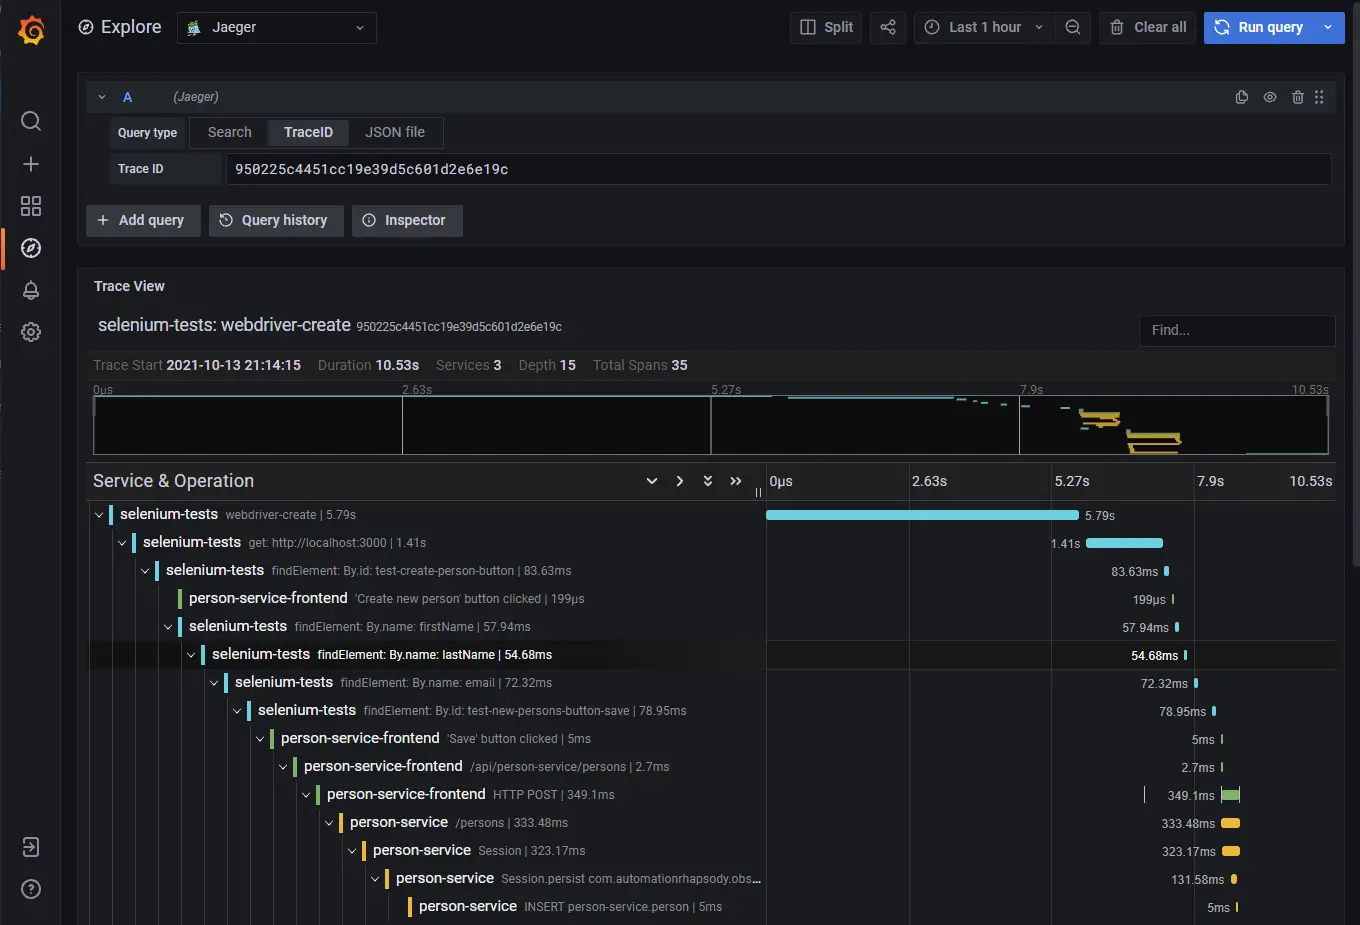
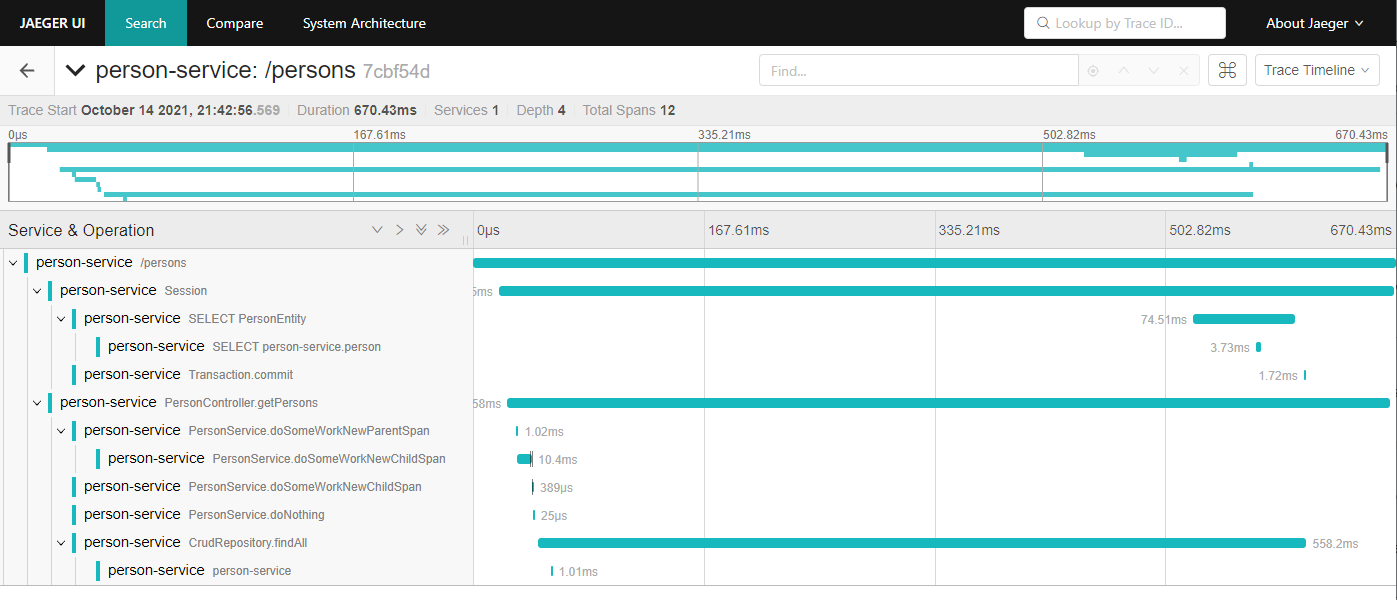
Traces output
In order to monitor a trace, run the examples as described in Distributed system observability: complete end-to-end example with OpenTracing, Jaeger, Prometheus, Grafana, Spring Boot, React and Selenium. Accessing http://localhost:8090/persons generates a trace in Jaeger:
Conclusion
With the steps described above, create a basic Spring Boot application is fairly easy. It is even easier instrumenting the application with OpenTelemetry tracing, just by adding the Java agent JAR. Custom tracing is also made easy with @WithSpan annotation. Traces give very valuable information about the performance of the different parts of the application.