Code coverage of .NET Core unit tests with OpenCover
Examples below are based on GitHub SampleDotNetCore2RestStub repository. Examples use code from .NET Core integration testing and mock dependencies post. Those are integration tests because they test more than one application module at a time, but they are run with a unit testing framework, this is why current post title is such.
Code coverage
This topic is how to do the code coverage on .NET Core unit tests with OpenCover. Theory on what is code coverage, why it is needed can be found in What about code coverage post.OpenCover
OpenCover is open source tool for code coverage for .NET 2.0 and above applications for Windows only. You can read more details about OpenCover in Code coverage of manual or automated tests with OpenCover for .NET applications post or you can visit their OpenCover Wiki page.Run OpenCover
In order to make this examples work you need to check out SampleDotNetCore2RestStub repository to C:\ and run all commands from project root folder C:\SampleDotNetCore2RestStub. OpenCover and ReportGenerator should be installed in C:\ as well. If you have different paths, just adjust them in commands shown below.C:\OpenCover\OpenCover.Console.exe `
-target:"c:\Program Files\dotnet\dotnet.exe" `
-targetargs:"test" `
-output:coverage.xml `
-oldStyle `
-filter:"+[SampleDotNetCore2RestStub*]* -[SampleDotNetCore2RestStub*Test*]*" `
-register:user
Enable .NET Core to debug output
If you run the command above you will get the following message:Committing… No results, this could be for a number of reasons. The most common reasons are: 1) missing PDBs for the assemblies that match the filter please review the output file and refer to the Usage guide (Usage.rtf) about filters. 2) the profiler may not be registered correctly, please refer to the Usage guide and the -register switch.
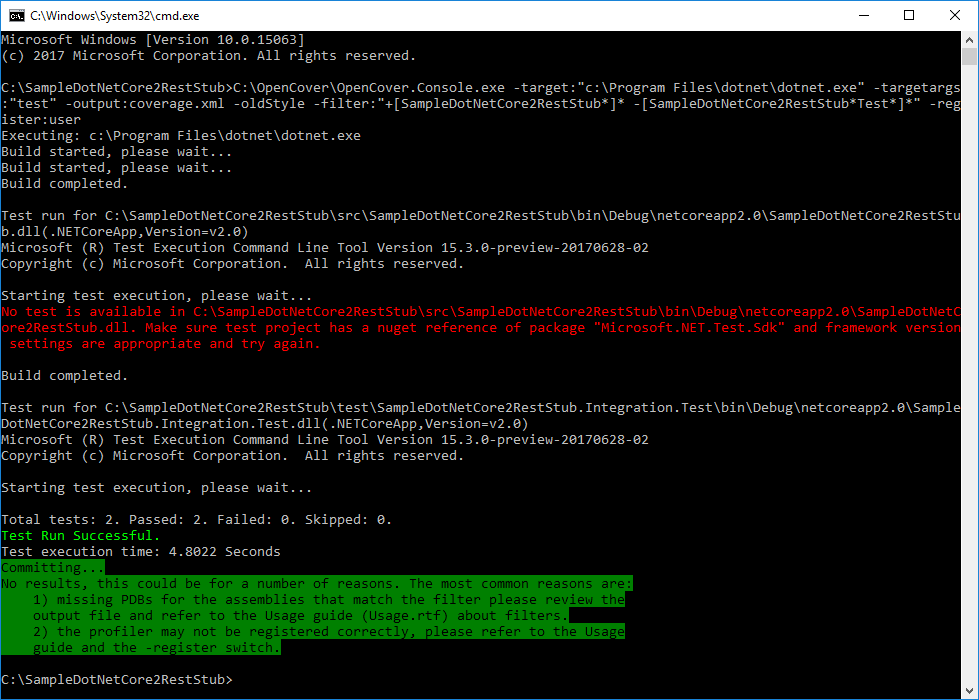
Note: error with red text shown on image above is because with -targetargs:“test” dotnet.exe tries to run tests inside all projects, but src\SampleDotNetCore2RestStub simply does not have tests. You can refine which test project to get run by changing to: -targetargs:“test test\SampleDotNetCore2RestStub.Integration.Test\SampleDotNetCore2RestStub.Integration.Test.csproj”.
Message for no results is because debug output is not enabled on .NET Core project and OpenCover does not have needed data to work on. Change src\SampleDotNetCore2RestStub\SampleDotNetCore2RestStub.csproj file by adding <DebugType>full</DebugType>:
<PropertyGroup>
    <OutputType>Exe</OutputType>
    <TargetFramework>netcoreapp2.0</TargetFramework>
    <DebugType>full</DebugType>
</PropertyGroup>
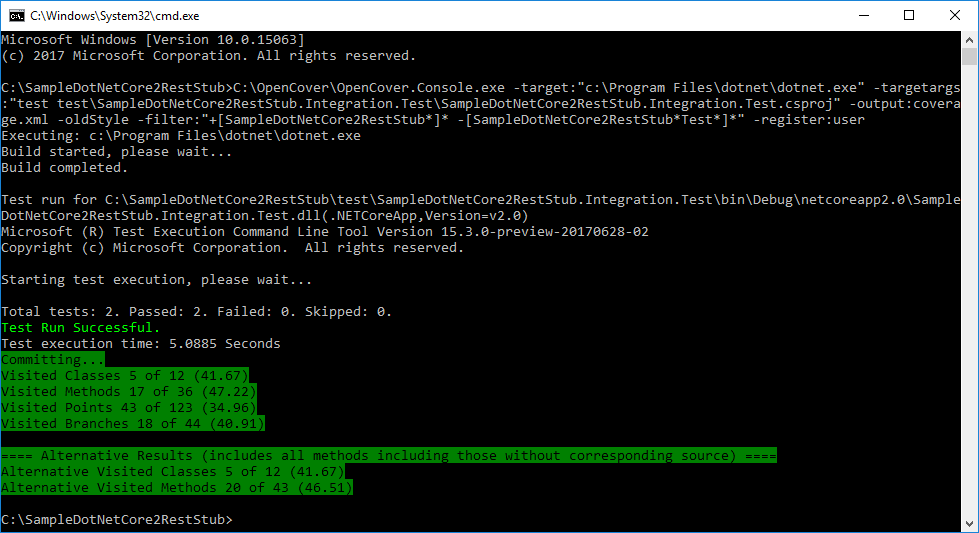
Now running the command gives proper output:
Committing… Visited Classes 5 of 12 (41.67) Visited Methods 17 of 36 (47.22) Visited Points 43 of 123 (34.96) Visited Branches 18 of 44 (40.91)
==== Alternative Results (includes all methods including those without corresponding source) ==== Alternative Visited Classes 5 of 12 (41.67) Alternative Visited Methods 20 of 43 (46.51)
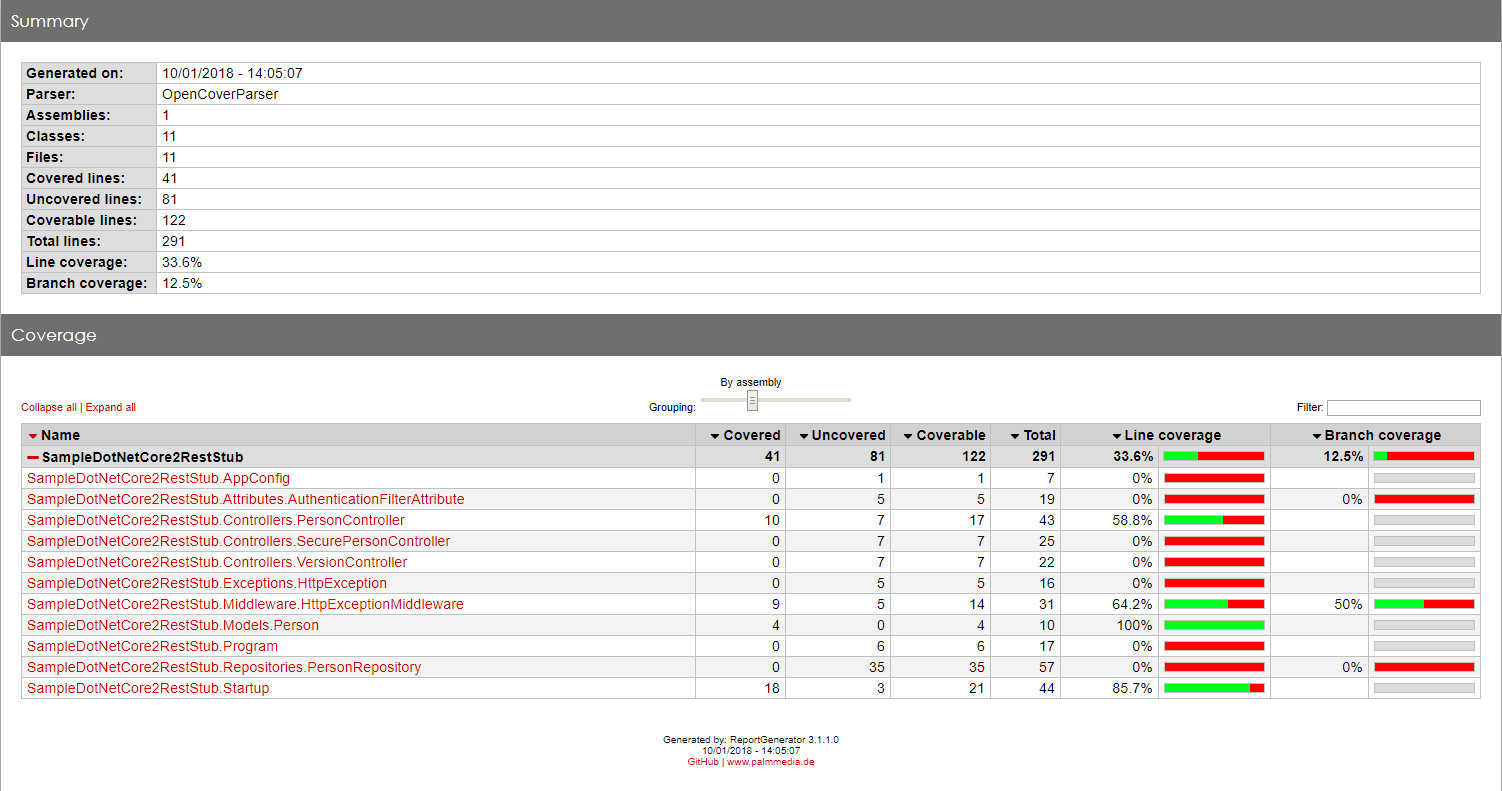
Generate report
ReportGenerator is used to convert XML reports generated by OpenCover, PartCover, Visual Studio or NCover into human-readable reports in various formats. To generate report use following command:C:\ReportGenerator\ReportGenerator.exe `
-reports:coverage.xml `
-targetdir:coverage
Inspect report
The report can be found in my examples: OpenCover .Net Core report. You can see what code is being covered during testing and what not.