Testing with Cypress - Custom logging of errors and JUnit results
This post is part of a Cypress series, you can see all post from the series in Testing with Cypress – lessons learned in a complete framework. Examples code is located in cypress-testing-framework GitHub repository.
The issue
Cypress is not good at error tracking and reporting. If a test fails it is hard to understand why. Errors sometimes are vague, stacktrace is not useful as it does not lead to the proper line of your code since it is being wrapped into Cypress' code. Forget about the nice stack traces that Java/C# code is producing, where you just go, find, and eliminate the error without even debugging. Debugging errors in tests is much harder with Cypress.The solution
Gleb Bahmutov, currently a VP of Engineering at Cypress.io has a nice NPM package, called cypress-failed-log. It gathers commands that Cypress was executing during a test run and in case of a failure saves them to a file. You can inspect the file and trace what parts of your test were executed.Modified solution
I started with that solution but did not enjoy it much. What I did is to take the base code and modify it. Those modifications are still tracking the Cypress commands, but also they track requests and response being exchanged by application and the backend, so in case of error you can also inspect the backend response. One important thing is that each test should have a unique name, otherwise overlapping may occur. The logging code is located in cypress/support/core/cypress_logging.js file, it is registered to Cypress within cypress/support/index.js file with import './core/cypress_logging';. The code also copies the screenshot of the test failure for better understanding of the error.Capturing of request/response between the backend and the frontend can be controlled with TEST_CAPTURE_RESPONSES environment variable, it is true by default. Sometimes you will need to avoid certain requests/responses from being captured as they are not important. This can be done with TEST_CAPTURE_RESPONSES_EXCLUDE_PATHS variable, use asterisks to match the URLs. For e.g. I am testing a Ruby on Rails application which has a profiler enabled, which massively pollutes the logs, so I exclude those with ‘/mini-profiler-resources/’ pattern.
All this data is saved as a file with the name of the test inside a folder with the name of the suite. For e.g. cypress/logs/logging/multiple_testsuites_mix_spec.js/Test suite mix #1 — test case #2 (failed).json. The name of the JSON file is same as the name of the automatically generated screenshot on failure.
JUnit results with Cypress
In order to make Cypress output the test results into JUnit XML file following steps has to be done. Add the following configuration into cypress.json. This configuration makes Cypress create JUnit XML file. The important bit here is [hash] in the file name, otherwise, Cypress will overwrite the files.{
"reporter": "junit",
"reporterOptions": {
"mochaFile": "results/my-test-output-[hash].xml"
}
}
If you use some CI tool then you can pass the XML results to it and it will visualize them.
Additionally, you can manipulate the XML results, you can merge them into just one XML file by installing junit-merge as a global NPM package and run junit-merge -d results -o results/merged.xml.
You can generate an HTML from XMLs with xunit-viewer NPM package. In case you have merged the XMLs into one then the command is xunit-viewer —results=results/merged.xml —output=results/merged.html, in case you have not the command is xunit-viewer —results=results —output=results/merged.html.
Custom JUnit results
Well, the out of the box solution is good but not enough for me. It does not show the skipped tests, it adds one more testsuite with name Root Suite, which is empty and Jenkins for e.g. avoids it, but if you want to visualize the results into HTML then it is a problem. What I have done is to generate JUnit XML on my own. This happens automatically in cypress_logging.js file. Files are put into the cypress/logs folder and have the name of the suite. Processing of the custom results is additionally made in provided code, you can read mode in Testing with Cypress - Code with Istanbul post.Compare of JUnit reports
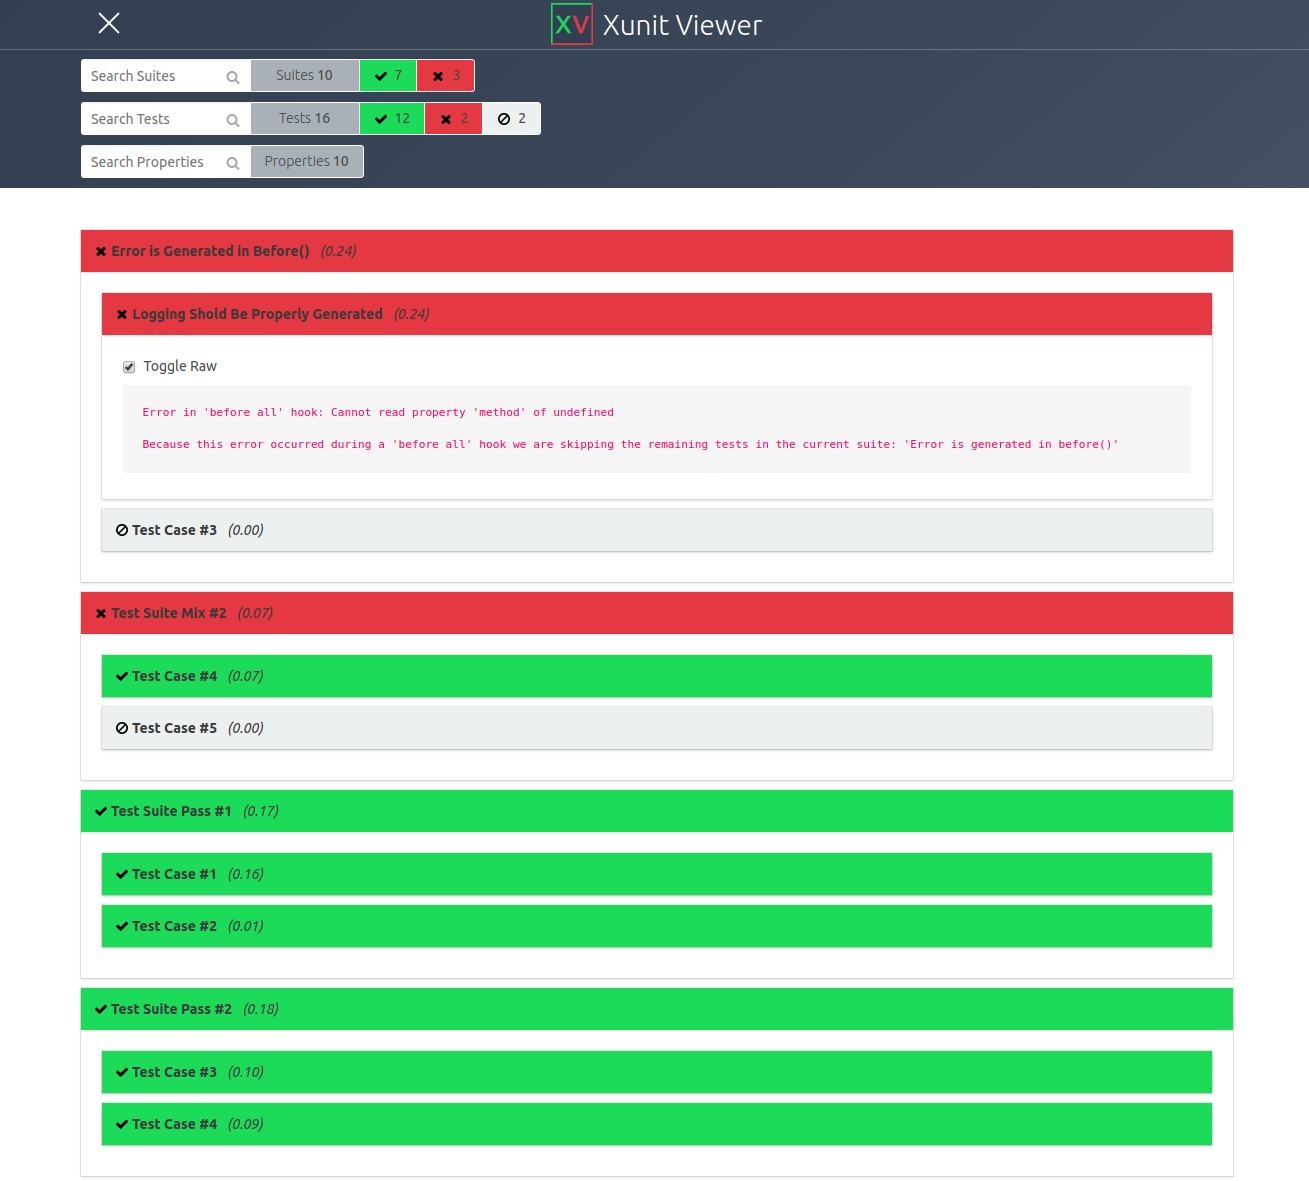
In this section, I will put some comparison of Cypress JUnit results and the one I have created. See the images below how HTML report looks like. HTML files can be opened from Cypress-report.html and Custom-report.html. XML results can be downloaded from xmls.zip.Cypress standard HTML report
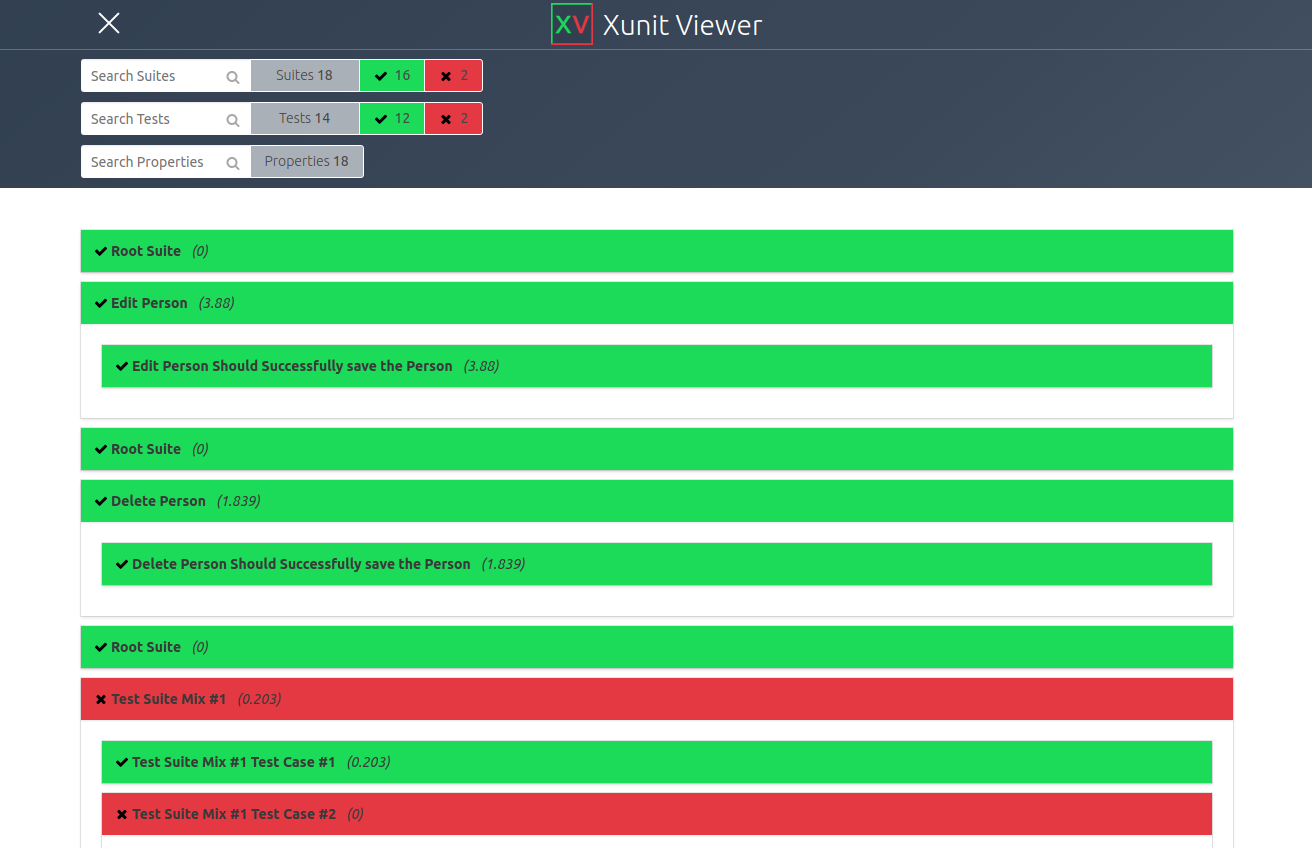
Cypress custom HTML report
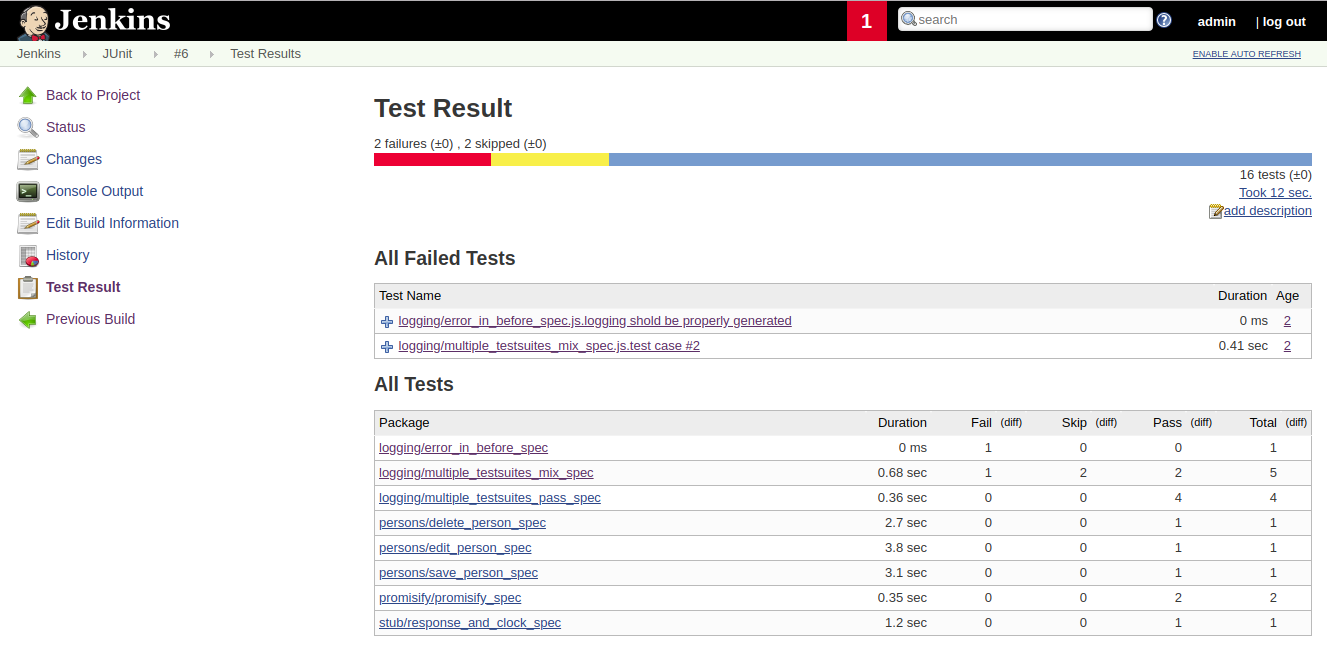
I also made a quick Jenkins installation from its Docker container and uploaded the results for comparison. Below are the images of the comparison. Both JUnit reports are not visualized very well. Mostly this is because of the fact that JUnit is a format for Java tests, where we have packages and Jenkins is visualizing the results based on this assumption.
Cypress Jenkins standard
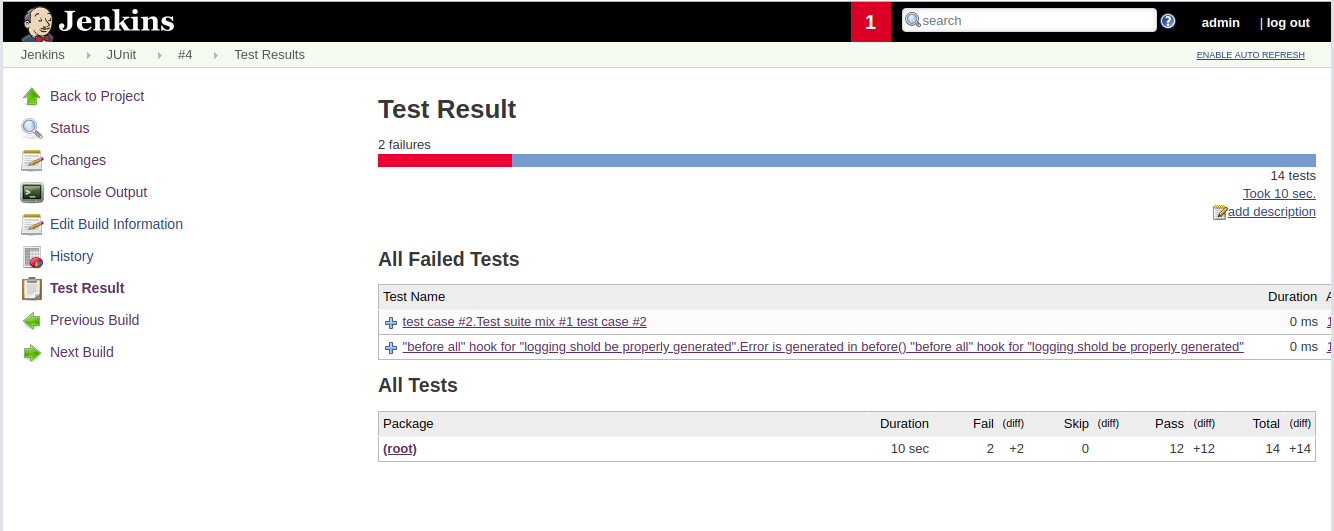
Cypress Jenkins custom