Monthly Archives: November 2021

Basic overview of software design patterns

Last Updated on by

Post summary: Basic overview of design patterns.

Although I have touched on the topic of design patterns in my Design patterns every test automation engineer should know post, I wanted for a long time to bring an article on the full topic. It is an important topic for software developers because knowing it or not they are in our everyday life. We need to be able to properly structure our code, so it is better that we are aware of them. In the current post, I will just give an overview of the patterns, the implementation details can be found all over the internet. I like Design Patterns in Java Tutorial because it is simple and is a very good starting point, and The Catalog of Design Patterns gives much more details and use-cases.

Design patterns

Design patterns give guidance on how to solve common scenarios and how to structure the code during software development. The main goal of using design patterns is to make the code easy to maintain, hence reducing the maintainability costs. Design patterns are split into several groups: creational patterns, structural patterns, and behavioral patterns.

Creational patterns

Patterns in this group are concerned about the creation of objects in a commonplace, rather than using the new operator where a new object is needed. This provides better re-usability and control over how objects are created. Please check the Creational patterns rules of thumb section which gives a very good overview of differences and combinations of the design patterns.

  • Factory Method – One class is responsible for creating different objects which implement one and the same interface. Object creation is done in one step by the factory method, which accepts arguments to define what type of object is needed.
  • Abstract Factory – A factory of factories used to create objects with similar characteristics. One class is responsible to create factory objects which are later used to create objects with their factory methods.
  • Builder – Builds complex objects step by step. The same builder process can be used to create different objects depending on the use case.
  • Object Pool – Cache objects in order to increase performance in case of too many expensive objects being created, but not that many are in use.
  • Prototype – Keeps an instance of an object, which is used to create a new object by cloning the cached one. Used in cases where the initial object creation requires significant resources and copying the prototype is a much faster operation.
  • Singleton – Ensures that only one instance of an object is available in the system. The object can be instantiated on-demand or on system startup by static block.

Structural patterns

Patterns in this group are concerned about object composition or representation. They optimize the objects and their relations. Please check the Structural patterns rules of thumb section which gives a very good overview of differences and combinations of the design patterns.

  • Adapter – Connects two incompatible interfaces. An object wraps a class implementing one of the interfaces, then this object implements the methods of the other interface.
  • Bridge – Separates an object’s interface from its implementation.
  • Filter – Filters set of objects based on different criteria or logical operators. Concrete criteria and operators are classes, implementing the criteria interface.
  • Composite – Compose objects into tree structures to represent whole-part hierarchies. An object can contain a list of similar objects, which are related somehow to it.
  • Decorator – Adds new functionalities to already existing objects, by using composition instead of inheritance. The decorator class holds an instance of the object and uses its functionality, it also can add more functionalities along with existing ones.
  • Facade – Defines higher-level interface on top of existing complex interfaces in order to ease the usage of the existing interfaces by hiding the complexity.
  • Flyweight – Reduces the number of created objects by caching and re-using already existing similar objects.
  • Private Class Data – Encapsulates the data of the class into a separate data class and controls access to the data.
  • Proxy – Controls access to another object.

Behavioral patterns

Patterns in this group are concerned about communication and interaction between objects. Please check the Behavioral patterns rules of thumb section which gives a very good overview of differences and combinations of the design patterns.

  • Chain of responsibility – Provides a series of processing objects which sequentially process a request. Objects in the chain decide which one is the most appropriate to process the request and whether to end processing or continue with the next handler.
  • Command – Decouples the object invoking the operation from the one executing it by encapsulating a command request as an object which then is passed to the invoking object.
  • Interpreter – Provides a way to evaluate language grammar or expression. The pattern uses a class to represent each grammar rule. Each rule is either composite or terminal, they are used together to solve the problem.
  • Iterator – Provides a way to access the elements of a collection in a sequential manner without any need to know its underlying representation.
  • Mediator – Define an object that encapsulates and manages how a set of objects interact.
  • Memento – Captures an object’s internal state in order to be able to restore it later.
  • Null Object – Act as a default value of an object. Used when in case of null no action is expected by the system, this removes the need for constant null checking.
  • Observer – Observes for changes and propagates a change of an object to all other objects related to it.
  • State – Changes an object’s behavior when its state changes.
  • Strategy – Encapsulates an algorithm inside a class. Creates objects which represent various strategies and a context object whose behavior varies as per its strategy object.
  • Template method – Defines an abstract class that exposes a predefined way (a template) to execute its methods. Its subclasses can override the method implementation as per need but the invocation is in the same way as defined by an abstract class.
  • Visitor – Represents an operation to be performed on the elements of an object structure. Visitor lets you define a new operation without changing the classes of the elements on which it operates.

Conclusion

The current post gives a basic overview of a very important topic for software engineers, design patterns. Internet is full of resources with more details on how those are implemented.

Related Posts

Read more...

Distributed system observability: extract and visualize metrics from OpenTelemetry spans

Last Updated on by

Post summary: How to extract metrics from spans by OpenTelementry collector, store them in Prometheus and properly visualize them in Grafana.

This post is part of Distributed system observability: complete end-to-end example series. The code used for this series of blog posts is located in selenium-observability-java GitHub repository.

Prometheus and metrics

Prometheus is an open-source monitoring and alerting toolkit. Prometheus collects and stores its metrics. Metrics information is stored with the timestamp at which it was recorded, alongside optional key-value pairs called labels. Metric is a way to measure something, e.g. how many people had read the current article. Metrics change over time, and Prometheus is recording and graphically visualizing the change over time.

Extract metrics from spans in OpenTelementry Collector

OpenTelemetry collector receives tracing data from the frontend, converts it into Jaeger format, and exports it to the Jaeger backend. Every span has duration, which is a metric. In order to extract the metric, the Span Metrics Processor contributors library is used. Full configurations are in otel-config.yaml. In the file are configured receivers, processors, exporters, and service, There are two receivers: oltp is receiving the traces; otlp/spanmetrics is a dummy receiver, that is never used, but the pipeline requires one to be present. There are two processors: batch compresses the data into batches and optimizes data transmission; spanmetrics extracts the metrics from spans. Spanmetrics configuration should have metrics_exporter, prometheus in the current case, which is existing in the exporters section of the configuration. An optional configuration is latency_histogram_buckets, which defines the histogram buckets. This is a very important concept and will be explained later. There are two exporters: jaeger sends the data to Jaeger backend; prometheus defines an endpoint, which Prometheus can fetch the metrics from, 0.0.0.0:8889 in the current example. Port 8889 also has to be exposed in docker-compose.yml file. The service section is used to configure what components are enabled. In the current example, otlp receiver takes the traces and exports them to jaeger, also traces are being processed by spanmetrics processor and exported as metrics to prometheus endpoint. More details can be found in OpenTelemetry Collector configuration.

receivers:
  otlp:
    protocols:
      grpc:
      http:
  otlp/spanmetrics:
    protocols:
      grpc:
        endpoint: 0.0.0.0:12346

processors:
  batch:
  spanmetrics:
    metrics_exporter: prometheus
    latency_histogram_buckets:
      [200ms, 400ms, 800ms, 1s, 1200ms, 1400ms, 1600ms, 1800ms, 2s, 5s, 7s]

exporters:
  jaeger:
    endpoint: jaeger:14250
    tls:
      insecure: true
  prometheus:
    endpoint: 0.0.0.0:8889
    metric_expiration: 1440m

service:
  pipelines:
    traces:
      receivers: [otlp]
      processors: [spanmetrics, batch]
      exporters: [jaeger]
    metrics:
      receivers: [otlp/spanmetrics]
      exporters: [prometheus]

Prometheus histogram by OpenTelemetry Collector

A Prometheus histogram collects metrics and counts them in configurable buckets. It also provides a sum of all observed values. Buckets are separate measurable dimensions that metrics are put into. In the current example, the buckets are [200ms, 400ms, 800ms, 1s, 1200ms, 1400ms, 1600ms, 1800ms, 2s, 5s, 7s]. Spans that are being received by the frontend are compared by their duration and put into a separate metric bucket. The easiest way to illustrate this is with an example. If a request takes 1.29 seconds, then buckets from 200ms to 1200ms are untouched, all other buckets from 1400ms to 7s are increased with a value of 1. When the next request comes with a duration of 1.99 seconds, then buckets from 200ms to 1800ms are untouched, buckets from 2s to 7s are increased with a value of 1. This is hard to understand but is a very important concept. You can experiment by running the examples, then open the frontend at http://localhost:3000/, and click the “Fetch persons” button. Observe the metrics buckets at OpenTelemetry Collector http://localhost:8889/metrics. The metrics of the two example requests above are visialized in the screenshot below. Buckets are with name latency_bucket and additional labels to identify the correct span. The span name is set into the operation label in the bucket. In the current example, “GET /api/person-service/persons” span is used. Along with the configured buckets, there are two additional buckets – 9.223372036854775e+12 – I truly do not what that is, and +Inf – this is the default bucket for all requests which does not fit the predefined buckets, i.e. longer than 7 seconds. There are two more counters – latency_sum – the total time in milliseconds that all the requests took, in our case – 1.29s + 1.99s = 3279ms; latency_count – the total number of requests, in our case – 2.

Visualize in Grafana

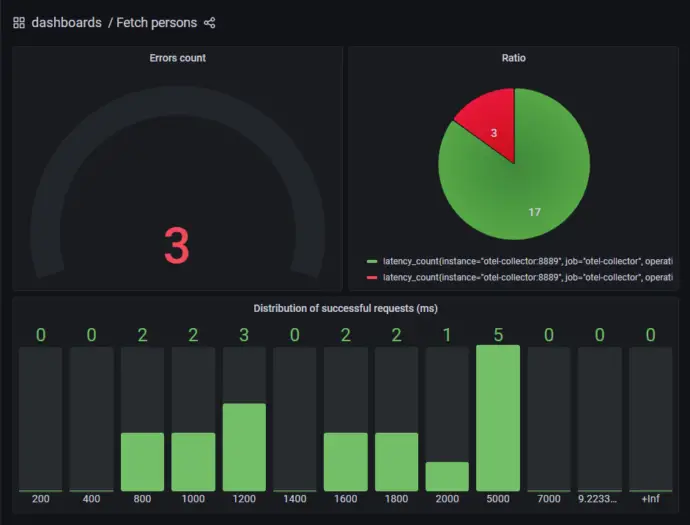
The two requests listed above are visualized in Grafana as shown below, one request is in the 1400ms (1200ms-1400ms) bucket, one request is in the 2000ms (1800ms-2000ms) bucket.

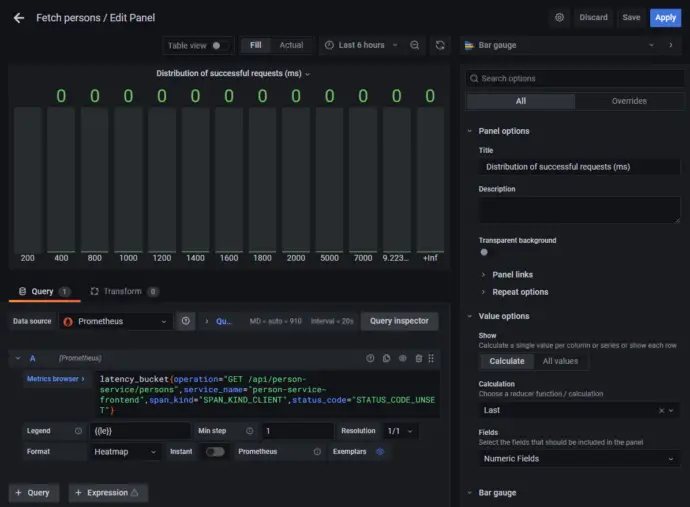
The panel above is defined in Grafana. It is a Bar gauge, the data source is Prometheus, Metric browser is latency_bucket{operation=”GET /api/person-service/persons”,service_name=”person-service-frontend”,span_kind=”SPAN_KIND_CLIENT”,status_code=”STATUS_CODE_UNSET”}, Legend is {{le}}, Min step is 1, Format is Heatmap.

Working with histogram buckets is a complex task, How to visualize Prometheus histograms in Grafana post gives good guidance.

A custom dashboard is created in the examples, it is accessible at http://localhost:3001/d/bgZ6Mf5nk/fetch-persons?orgId=1. The dashboard is defined in etc/grafana-custom-dashboard.json file.

Conclusion

In the current post, I have shown how to make OpenTelemetry Collector convert the spans into metrics, which can be fetched by Prometheus and visualized in Grafana.

Related Posts

Read more...

Distributed system observability: Instrument Cypress tests with OpenTelemetry

Last Updated on by

Post summary: Instrument Cypress tests with OpenTelemetry and be able to custom trace the tests.

This post is part of Distributed system observability: complete end-to-end example series. The code used for this series of blog posts is located in selenium-observability-java GitHub repository.

Cypress

Cypress is a front-end testing tool built for the modern web. It is most often compared to Selenium; however, Cypress is both fundamentally and architecturally different. I have lots of experience with Cypress, I have written for it in Testing with Cypress – lessons learned in a complete framework post. Although it provides some benefits over Selenium, it also comes with its problems. Writing tests in Cypress is more complex than with Selenium. Cypress is more technically complex, which gives more power but is a real struggle for making decent test automation.

Cypress tests custom observability

As stated before, in the case of HTTP calls, the OpenTelemetry binding between both parties is the traceparent header. I want to bind the Selenium tests with the frontend, so it comes naturally to mind – open the URL in the browser and provide this HTTP header. After research, I could not find a way to achieve this. I implemented a custom solution, which is Cypress independent and can be customized as needed. Moreover, it is a web automation framework independent, this approach can be used with any web automation tool. See examples for the same approach in Selenium in Distributed system observability: Instrument Selenium tests with OpenTelemetry post.

Instrument the frontend

In order to achieve linking, a JavaScript function is exposed in the frontend, which creates a parent Span. Then this JS function is called from the tests when needed. This function is named startBindingSpan() and is registered with the window global object. It creates a binding span with the same attributes (traceId, spanId, traceFlags) as the span used in the Selenium tests. This span never ends, so is not recorded in the traces. In order to enable this span, the traceSpan() function has to be manually used in the frontend code, because it links the current frontend context with the binding span. I have added another function, called flushTraces(). It forces the OpenTelemetry library to report the traces to Jaeger. Reporting is done with an HTTP call and the browser should not exit before all reporting requests are sent.

Note: some people consider exposing such a window-bound function in the frontend to modify React state as an anti-pattern. Frontend code is in src/helpers/tracing/index.ts:

declare const window: any
var bindingSpan: Span | undefined

window.startBindingSpan = (traceId: string, spanId: string, traceFlags: number) => {
  bindingSpan = webTracerWithZone.startSpan('')
  bindingSpan.spanContext().traceId = traceId
  bindingSpan.spanContext().spanId = spanId
  bindingSpan.spanContext().traceFlags = traceFlags
}

window.flushTraces = () => {
  provider.activeSpanProcessor.forceFlush().then(() => console.log('flushed'))
}

export function traceSpan<F extends (...args: any)
    => ReturnType<F>>(name: string, func: F): ReturnType<F> {
  var singleSpan: Span
  if (bindingSpan) {
    const ctx = trace.setSpan(context.active(), bindingSpan)
    singleSpan = webTracerWithZone.startSpan(name, undefined, ctx)
    bindingSpan = undefined
  } else {
    singleSpan = webTracerWithZone.startSpan(name)
  }
  return context.with(trace.setSpan(context.active(), singleSpan), () => {
    try {
      const result = func()
      singleSpan.end()
      return result
    } catch (error) {
      singleSpan.setStatus({ code: SpanStatusCode.ERROR })
      singleSpan.end()
      throw error
    }
  })
}

Instrument Cypress tests

In order to achieve the tracing, OpenTelemetry JavaScript libraries are needed. Those libraries are the same used in the frontend and described in Distributed system observability: Instrument React application with OpenTelemetry post. Those libraries send the data in OpenTelemetry format, so OpenTelemetry Collector is needed to convert the traces into Jaeger format. OpenTelemetry collector is already started into the Docker compose landscape, so it just needs to be used, its endpoint is http://localhost:4318/v1/trace. There is a function that creates an OpenTelemetry tracer. I have created two implementations on the tracing. One is by extending the existing Cypress commands. Another is by creating a tracing wrapper around Cypress. Both of them use the tracer creating function. Both of them coexist in the same project, but cannot run simultaneously.

import { WebTracerProvider } from '@opentelemetry/sdk-trace-web'
import { Resource } from '@opentelemetry/resources'
import { SimpleSpanProcessor } from '@opentelemetry/sdk-trace-base'
import { CollectorTraceExporter } from '@opentelemetry/exporter-collector'
import { ZoneContextManager } from '@opentelemetry/context-zone'

export function initTracer(name) {
  const resource = new Resource({ 'service.name': name })
  const provider = new WebTracerProvider({ resource })

  const collector = new CollectorTraceExporter({
    url: 'http://localhost:4318/v1/trace'
  })
  provider.addSpanProcessor(new SimpleSpanProcessor(collector))
  provider.register({ contextManager: new ZoneContextManager() })

  return provider.getTracer(name)
}

Tracing Cypress tests – override default commands

Cypress allows you to overwrite existing commands. This feature will be used in order to do the tracing, commands will perform their normal functions, but also will trace. This is achieved in cypress-tests/cypress/support/commands_tracing.js file.

import { context, trace } from '@opentelemetry/api'
import { initTracer } from './init_tracing'

const webTracerWithZone = initTracer('cypress-tests-overwrite')

var mainSpan = undefined
var currentSpan = undefined
var mainWindow

function initTracing(name) {
  mainSpan = webTracerWithZone.startSpan(name)
  currentSpan = mainSpan
  trace.setSpan(context.active(), mainSpan)
  mainSpan.end()
}

function initWindow(window) {
  mainWindow = window
}

function createChildSpan(name) {
  const ctx = trace.setSpan(context.active(), currentSpan)
  const span = webTracerWithZone.startSpan(name, undefined, ctx)
  trace.setSpan(context.active(), span)
  return span
}

Cypress.Commands.add('initTracing', name => initTracing(name))

Cypress.Commands.add('initWindow', window => initWindow(window))

Cypress.Commands.overwrite('visit', (originalFn, url, options) => {
  currentSpan = mainSpan
  const span = createChildSpan(`visit: ${url}`)
  currentSpan = span
  const result = originalFn(url, options)
  span.end()
  return result
})

Cypress.Commands.overwrite('get', (originalFn, selector, options) => {
  const span = createChildSpan(`get: ${selector}`)
  currentSpan = span
  const result = originalFn(selector, options)
  span.end()
  mainWindow.startBindingSpan(span.spanContext().traceId,
    span.spanContext().spanId, span.spanContext().traceFlags)
  return result
})

Cypress.Commands.overwrite('click', (originalFn, subject, options) => {
  const span = createChildSpan(`click: ${subject.selector}`)
  const result = originalFn(subject, options)
  span.end()
  return result
})

Cypress.Commands.overwrite('type', (originalFn, subject, text, options) => {
  const span = createChildSpan(`type: ${text}`)
  const result = originalFn(subject, text, options)
  span.end()
  return result
})

This file with commands overwrite can be conditionally enabled and disabled with an environment variable. Variable is enableTracking and is defined in cypress.json file. This allows switching tracing on and off. In cypress.json file there is one more setting, chromeWebSecurity which overrides the CORS problem when tracing is sent to the OpenTelemetry collector. Cypress get command is the one that is used to do the linking between the tests and the frontend. It is calling the window.startBindingSpan function. In order for this to work, a window instance has to be set into the tests with the custom initWindow command.

Note: A special set of Page Objects is used with this implementation.

Tracing Cypress tests – implement a wrapper

Cypress allows you to overwrite existing commands. This feature will be used in order to do the tracing, commands will perform their normal functions, but also will trace. This is achieved in cypress-tests/cypress/support/tracing_cypress.js file.

import { context, trace } from '@opentelemetry/api'
import { initTracer } from './init_tracing'

export default class TracingCypress {
  constructor() {
    this.webTracerWithZone = initTracer('cypress-tests-wrapper')
    this.mainSpan = undefined
    this.currentSpan = undefined
  }

  _createChildSpan(name) {
    const ctx = trace.setSpan(context.active(), this.currentSpan)
    const span = this.webTracerWithZone.startSpan(name, undefined, ctx)
    trace.setSpan(context.active(), span)
    return span
  }

  initTracing(name) {
    this.mainSpan = this.webTracerWithZone.startSpan(name)
    this.currentSpan = this.mainSpan
    trace.setSpan(context.active(), this.mainSpan)
    this.mainSpan.end()
  }

  visit(url, options) {
    this.currentSpan = this.mainSpan
    const span = this._createChildSpan(`visit: ${url}`)
    this.currentSpan = span
    const result = cy.visit(url, options)
    span.end()
    return result
  }

  get(selector, options) {
    const span = this._createChildSpan(`get: ${selector}`)
    this.currentSpan = span
    const result = cy.get(selector, options)
    span.end()
    return result
  }

  click(subject, options) {
    const span = this._createChildSpan('click')
    subject.then(element =>
      element[0].ownerDocument.defaultView.startBindingSpan(
        span.spanContext().traceId,
        span.spanContext().spanId,
        span.spanContext().traceFlags
      )
    )
    const result = subject.click(options)
    span.end()
    return result
  }

  type(subject, text, options) {
    const span = this._createChildSpan(`type: ${text}`)
    const result = subject.type(text, options)
    span.end()
    return result
  }
}

In order to make this implementation work, it is mandatory to set enableTracking variable in cypress.json file to falseTracingCypress is instantiated in each and every test. An instance of it is provided as a constructor argument to the Page Object for this approach. The important part here is that the binding window.startBindingSpan is called in the get() method.

Note: A special set of Page Objects is used with this implementation.

End-to-end traces in Jaeger

Conclusion

In the given examples, I have shown how to instrument Cypress tests in order to be able to track how they perform. I have provided two approaches, with overwriting the default Cypress command and with providing a tracing wrapper for Cypress.

Related Posts

Read more...