Post summary: Create a React web application using the Material UI design system and instrument the application with OpenTelemetry.
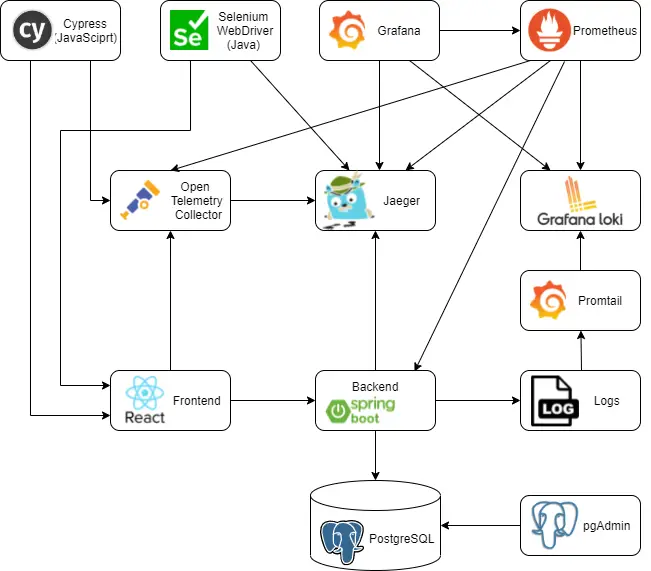
This post is part of Distributed system observability: complete end-to-end example series. The code used for this series of blog posts is located in selenium-observability-java GitHub repository.
React
React is a JavaScript library for building user interfaces.
Create React App
Create React App provides a simple way to create React applications from scratch. It also creates and abstracts the whole toolchain needed to develop JavaScript applications, such as WebPack and Babel, so the user does not need to bother with configuring those. Application is created with the following command: create-react-app my-app –template typescript.
Project structure
With the projects I have worked on professionally I am used to a specific folder structure of the project.
- src/components – re-usable components, building blocks, used across the application
- src/containers – components used to build the application, e.g. pages
- src/helpers – functionality not related to the presentation logic
- src/stylesheets – CSS files, which hold common and re-usable functionality
- src/types – TypeScript data models, e.g. models used with API communication
Material UI
Material UI is a React design system that provides ready-to-use components. An official example is shown in create-react-app-with-typescript.
TypeScript
TypeScript is a programming language developed and maintained by Microsoft. It is a strict syntactical superset of JavaScript and adds optional static typing to the language. TypeScript is designed for the development of large applications and transcompiles to JavaScript. TypeScript brings some overhead, but for me, this is justified. Because of the static typing, errors are shown on compile-time, not in runtime. Also, IntelliSense, the intelligent code completion, kicks in and is of great help.
Code examples
Main file is src/index.tsx. It loads the App component, which uses React Router to define different path handling, it loads different components based on the path. In the current example, /about path is covered just by a very simple page, and all other paths are loading PersonsPage.
index.tsx
import ReactDOM from 'react-dom'

import App from 'containers/App'
import reportWebVitals from './reportWebVitals'
import './stylesheets/base.scss'

ReactDOM.render(<App />, document.querySelector('#root'))

// If you want to start measuring performance in your app, pass a function
// to log results (for example: reportWebVitals(console.log))
// or send to an analytics endpoint. Learn more: https://bit.ly/CRA-vitals
reportWebVitals()
App
import { Router, Route, Switch } from 'react-router-dom'
import { createBrowserHistory } from 'history'
import { ThemeProvider } from '@mui/material/styles'
import { CssBaseline } from '@mui/material'

import PersonsPage from 'containers/PersonsPage'

import theme from 'stylesheets/theme'

export default () => (
  <ThemeProvider theme={theme}>
    <CssBaseline />
    <Router history={createBrowserHistory()}>
      <Switch>
        <Route exact path={'/about'}>
          <div>About Page</div>
        </Route>
        <Route>
          <PersonsPage />
        </Route>
      </Switch>
    </Router>
  </ThemeProvider>
)
PersonsPage
import React from 'react'

import { apiFetch } from 'helpers/api'
import { personServiceUrl } from 'helpers/config'
import { IPerson } from 'types/types'

import PersonsList from './PersonsList'

import TracingButton from 'components/TracingButton'
import CreateNewPersonModal from 'containers/CreateNewPersonModal'

import styles from './styles.module.scss'

export default () => {
  const [isModalOpen, setIsModalOpen] = React.useState<boolean>(false)
  const [persons, setPersons] = React.useState<IPerson[]>([])

  const fetchPersons = async () => {
    const persons = await apiFetch<IPerson[]>(`${personServiceUrl}/persons`)
    setPersons(persons)
  }

  return (
    <div className={styles.app}>
      <CreateNewPersonModal open={isModalOpen} onClose={() => setIsModalOpen(false)} />

      <header className={styles.appHeader}>
        <p>Sample Patient Service Frontend</p>
      </header>

      <TracingButton id="test-create-person-button" label={'Create new person'} onClick={() => setIsModalOpen(true)} />

      <TracingButton id="test-fetch-persons-button" label={'Fetch persons'} onClick={fetchPersons} />
      {persons.length > 0 && (
        <React.Fragment>
          <div id="test-persons-count-text">Found {persons.length} persons</div>
          <PersonsList persons={persons} />
        </React.Fragment>
      )}
    </div>
  )
}
Proxy
Cross-Origin Resource Sharing (CORS) is an HTTP-header-based mechanism that allows a server to indicate any origins (domain, scheme, or port) other than its own from which a browser should permit loading resources. In order to allow the frontend to connect to the backend, CORS should be allowed. One option is to instruct the backend to produce CORS headers that allow the frontend URL. Another option is to use React Create App’s mechanism to handle the CORS by defining a proxy. The file that is used is setupProxy.js. In the current examples, the proxy handles both connections to the backend and OpenTelementry connector.
const { createProxyMiddleware } = require('http-proxy-middleware')

const configureProxy = (path, target) =>
  createProxyMiddleware(path, {
    target: target,
    secure: false,
    pathRewrite: { [`^${path}`]: '' }
  })

module.exports = function (app) {
  app.use(configureProxy('/api/person-service', 'http://localhost:8090'))
  app.use(configureProxy('/api/tracing', 'http://localhost:4318'))
}
WebVitals
The default application has built-in support for WebVitals. If those need to be put into operation, a reporter just needs to be registered in src/index.tsx file by passing a method reference to reportWebVitals(). Easiest is to log to console: reportWebVitals(console.log). This can be enhanced further by creating a reporter which sends the data to Prometheus. Actually, pushing data to Prometheus is not possible. Prometheus Pushgateway can be used as metrics cache, from which Prometheus can pull.
Docker
The application is Dockerized with Nginx in exactly the same way as described in Dockerize React application with a Docker multi-staged build post.
Instrumentation
Instrumentation is done with OpenTracing JavaScript libraries. The API calls to the backend use the fetch() method. OpenTracing has a library that instruments all the calls going through fetch() – @opentelemetry/instrumentation-fetch. A WebTracerProvider is instantiated with a Resource that has the service.name. Several SimpleSpanProcessor are registered with addSpanProcessor() method. The important processor is the CollectorTraceExporter, which sends the traces to the OpenTelemetry collector. The actual tracer is returned by getTracer() method from the provider, it is used to do the custom tracing. registerInstrumentations() registers an instance of FetchInstrumentation, which actually traces the API calls. In case the API responds with a status code greater than 299, then this is considered an error, and the span is marked as ERROR. This is done in the applyCustomAttributesOnSpan function. Another custom change for fetch tracking is that the span name is overwritten in order to have a unique name for each API. This will allow separate tracing of each individual API. Custom traceSpan() method is defined in order to manually trace individual events in the application, such as a button click for e.g. In case of an error in the wrapped function func then span is also marked as an error.
import { context, trace, Span, SpanStatusCode } from '@opentelemetry/api'
import { WebTracerProvider } from '@opentelemetry/sdk-trace-web'
import { Resource } from '@opentelemetry/resources'
import { SimpleSpanProcessor } from '@opentelemetry/sdk-trace-base'
import { CollectorTraceExporter } from '@opentelemetry/exporter-collector'
import { ZoneContextManager } from '@opentelemetry/context-zone'
import { FetchInstrumentation } from '@opentelemetry/instrumentation-fetch'
import { FetchError } from '@opentelemetry/instrumentation-fetch/build/src/types'
import { registerInstrumentations } from '@opentelemetry/instrumentation'

import { tracingUrl } from 'helpers/config'

const resource = new Resource({ 'service.name': 'person-service-frontend' })
const provider = new WebTracerProvider({ resource })

const collector = new CollectorTraceExporter({ url: tracingUrl })
provider.addSpanProcessor(new SimpleSpanProcessor(collector))
provider.register({ contextManager: new ZoneContextManager() })

const webTracerWithZone = provider.getTracer('person-service-frontend')

registerInstrumentations({
  instrumentations: [
    new FetchInstrumentation({
      propagateTraceHeaderCorsUrls: ['/.*/g'],
      clearTimingResources: true,
      applyCustomAttributesOnSpan:
      (span: Span, request: Request | RequestInit, result: Response | FetchError) => {
        const attributes = (span as any).attributes
        if (attributes.component === 'fetch') {
          span.updateName(`${attributes['http.method']} ${attributes['http.url']}`)
        }
        if (result.status && result.status > 299) {
          span.setStatus({ code: SpanStatusCode.ERROR })
        }
      }
    })
  ]
})

export function traceSpan<F extends (...args: any)
    => ReturnType<F>>(name: string, func: F): ReturnType<F> {
  var singleSpan = webTracerWithZone.startSpan(name)
  return context.with(trace.setSpan(context.active(), singleSpan), () => {
    try {
      const result = func()
      singleSpan.end()
      return result
    } catch (error) {
      singleSpan.setStatus({ code: SpanStatusCode.ERROR })
      singleSpan.end()
      throw error
    }
  })
}
Custom instrumentation
import { Button } from '@mui/material'

import { traceSpan } from 'helpers/tracing'

import styles from './styles.module.scss'

interface Props {
  label: string
  id?: string
  secondary?: boolean
  onClick: () => void
}

export default (props: Props) => {
  const onClick = async () => traceSpan(`'${props.label}' button clicked`, props.onClick)

  return (
    <div className={styles.button}>
      <Button id={props.id} variant={'contained'} color={props.secondary ? 'secondary' : 'primary'} onClick={onClick}>
        {props.label}
      </Button>
    </div>
  )
}
Traceability
Traceability between the frontend and the backend is described in the Trace Context W3C standard. In a nutshell, this is done by adding a traceparent header in the HTTP request to the backend. This is done automatically by @opentelemetry/instrumentation-fetch.
React component instrumentation
OpenTelemetry provides a library that can instrument React components and monitor their performance, such as load time for e.g. This library is called @opentelemetry/plugin-react-load. I tried it, it is working properly, but it is not in the current examples for two reasons. The first is that I am not really interested in React component lifecycle events. The more important reason is that this plugin works for React class components only. I started my React journey after version 16.8, which was released on 6 Feb 2019. Prior to this version functional components were stateless, they were just for data visualization purposes. In version 16.8 hooks have been introduced, which allows state management inside a functional component. I write all my components to be functional with hooks for state management. I do not have justification whether this is good or bad, I like it that way. There is a serious drawback because functions in the functional component reinitialize every time the component is re-rendered, in some cases I had to use useCallback() hook to remember some function state.
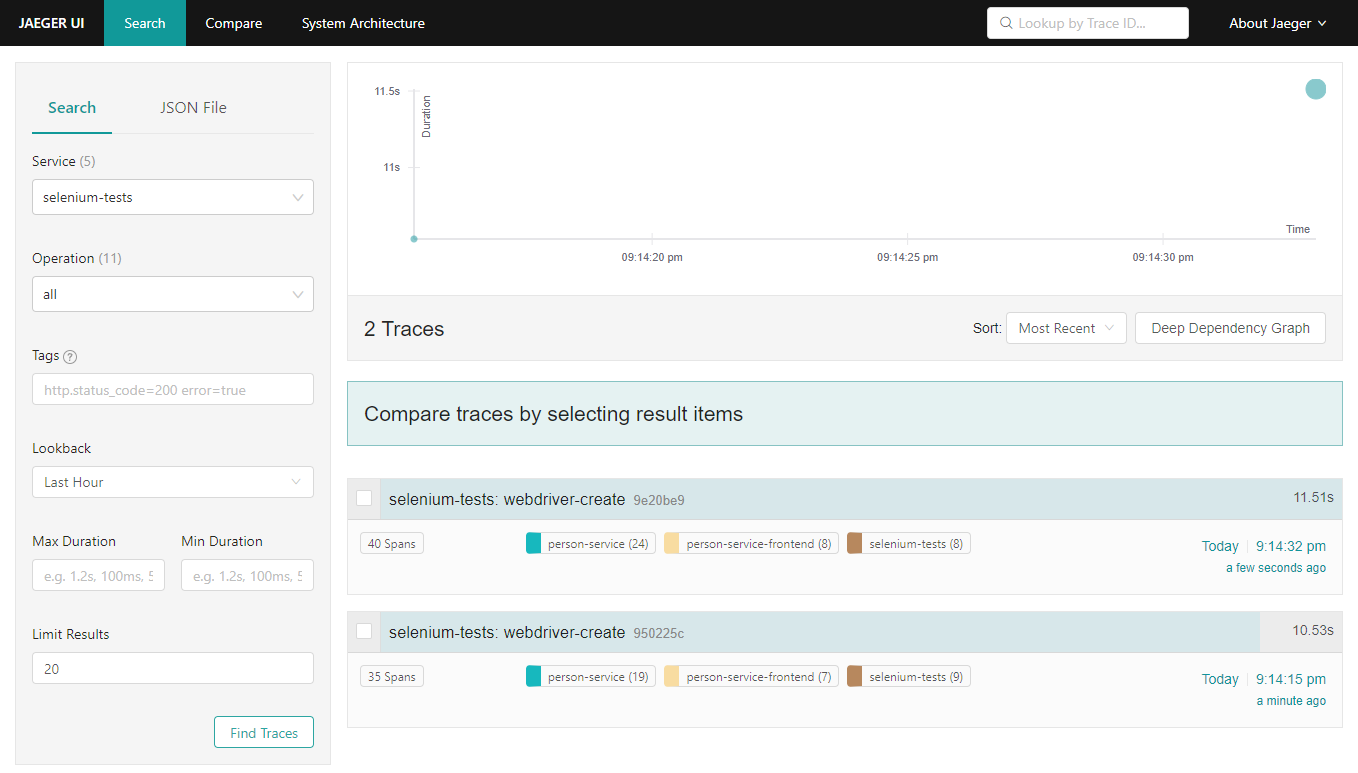
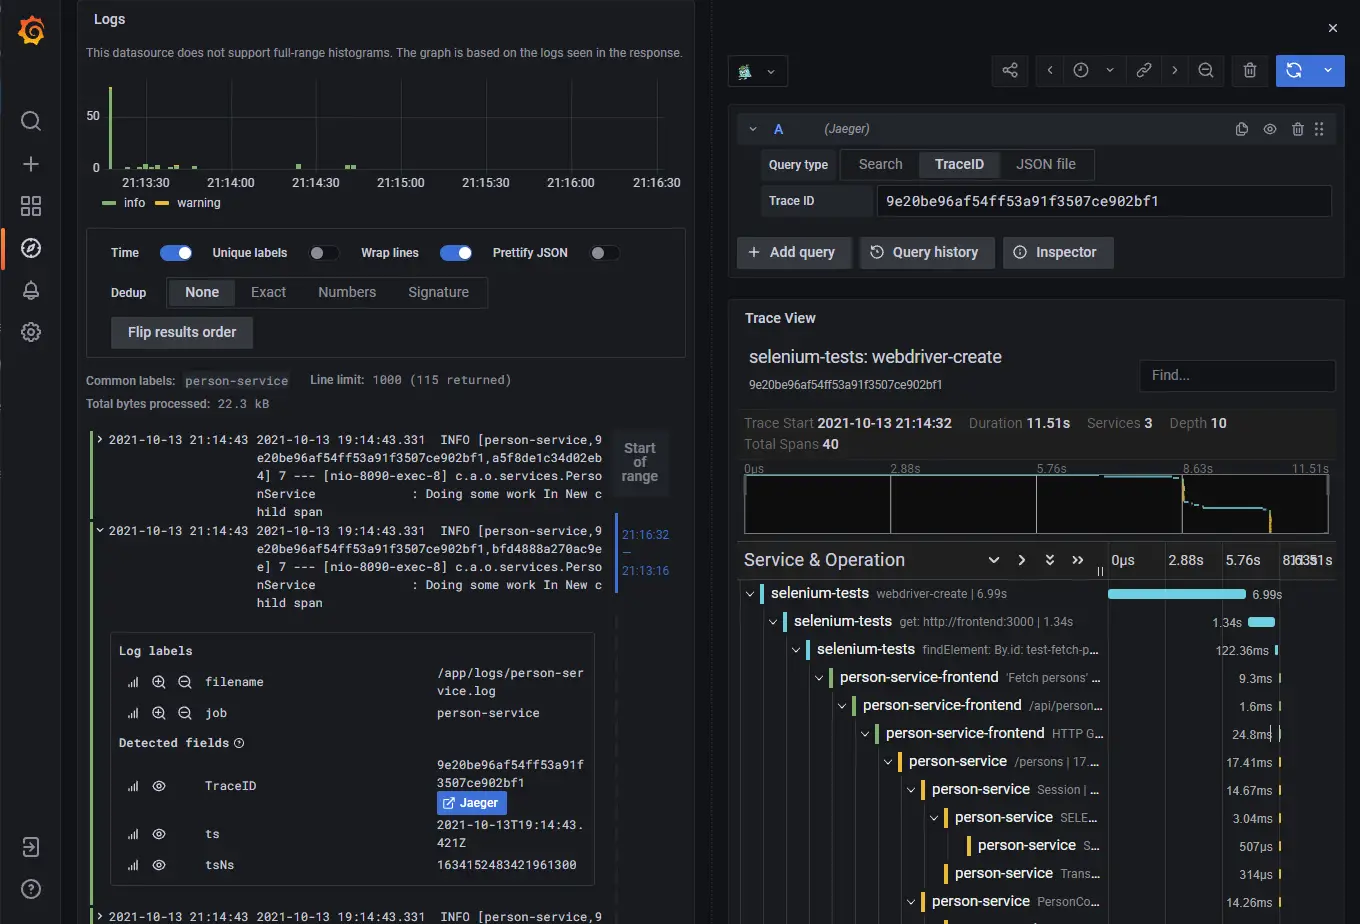
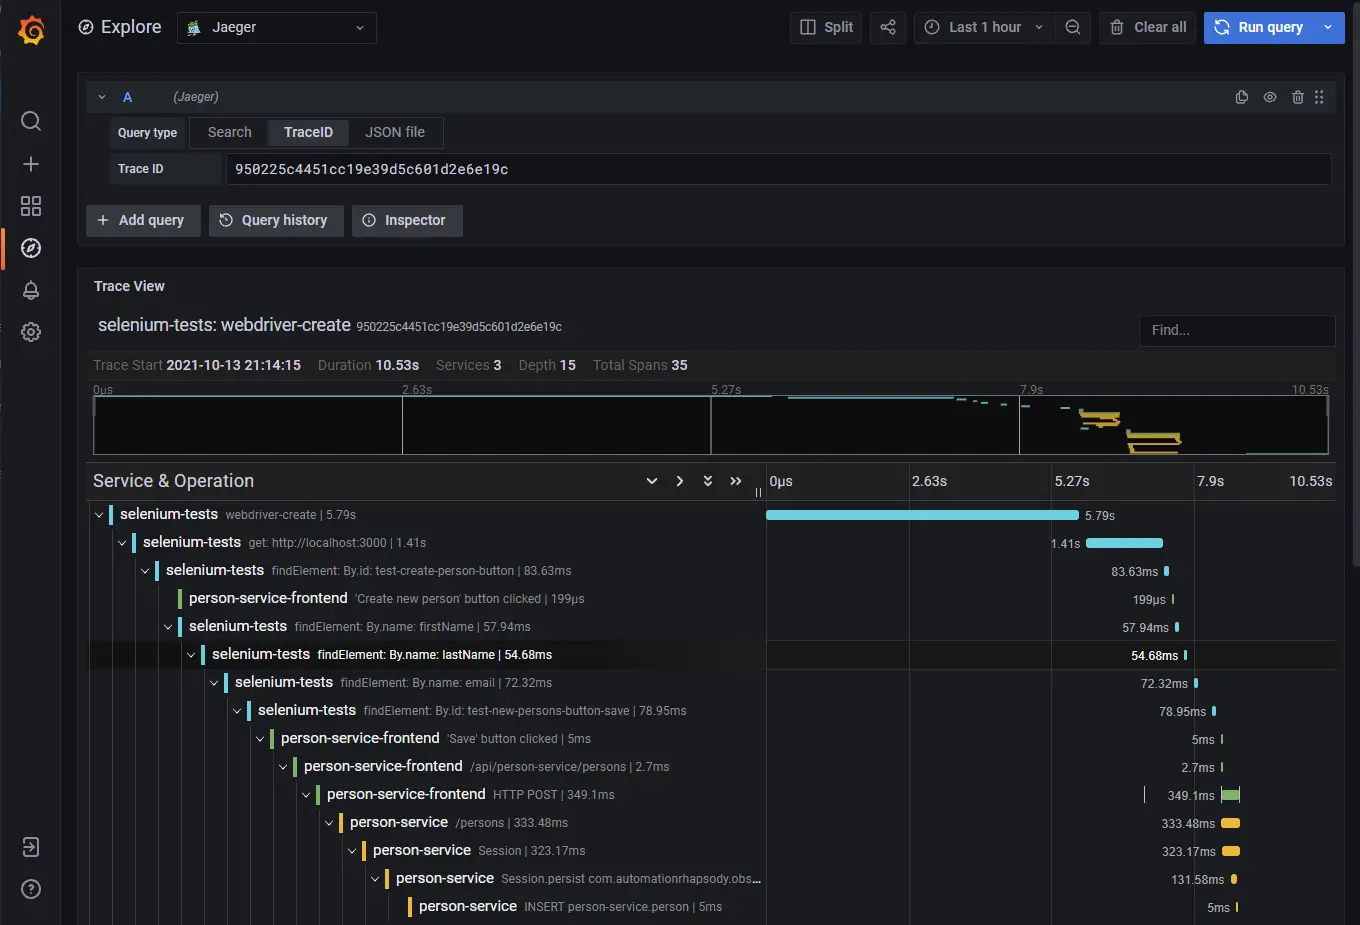
Traces output
In order to monitor a trace, run the examples as described in Distributed system observability: complete end-to-end example with OpenTracing, Jaeger, Prometheus, Grafana, Spring Boot, React and Selenium. Accessing http://localhost:3000/ and clicking “Fetch persons” button generates a trace in Jaeger:

Conclusion
OpenTelemetry provides libraries to instrument JavaScript applications and to report the traces to an OpenTelemetry collector. Creating an application with React and instrumenting it to collect OpenTelemetry traces is easy. Behind the scenes, the fetch() method is modified to pass traceparent header in the HTTP request to the backend. This is how tracing between different systems can happen.