Code coverage with JaCoCo offline instrumentation with Maven

Last Updated on by

Post summary: Tutorial how to do code coverage with offline instrumentation with JaCoCo and Maven.

Offline instrumentation

Code coverage of manual or automated tests with JaCoCo post describes how to do code coverage with JaCoCo. This is applicable in many of the cases. Still, there could be a case where the application under test does not support Java agents. In this case, JaCoCo offers offline instrumentation of the code. A once instrumented code can be run and coverage to be measured. This post describes how to do it.

JaCoCo for Maven

JaCoCo Maven plugin is discussed in Automated code coverage of unit tests with JaCoCo and Maven post. In order to get code instrumented “instrument” task should be added to Maven:

<properties>
	<jacoco.skip.instrument>true</jacoco.skip.instrument>
</properties>
<build>
	<plugins>
		<plugin>
			<groupId>org.jacoco</groupId>
			<artifactId>jacoco-maven-plugin</artifactId>
			<version>0.7.4.201502262128</version>
			<executions>
				<execution>
					<id>jacoco-instrument</id>
					<phase>test</phase>
					<goals>
						<goal>instrument</goal>
					</goals>
					<configuration>
						<skip>${jacoco.skip.instrument}</skip>
					</configuration>
				</execution>
			</executions>
		</plugin>
	</plugins>
</build>

In the current example, this task will be executed when mvn test is called. It can be configured to be called on package or install by changing the <phase> element.

Make it configurable

Instrumentation should not be done on every build. You do not want to release instrumented code, first because this is bad practice and second code will not run unless jacocoagent.jar is in the classpath. This is why instrumentation should be disabled by default with jacoco.skip.instrument=true in pom.xml property, which can be overridden when needed with mvn clean test -Djacoco.skip.instrument=false command. Another option is separate pom-offline.xml file and build with it when needed.

Get sample application

Current post uses sample application first introduced in Build a RESTful stub server with Dropwizard post. It can be found in GitHub sample-dropwizard-rest-stub repository. For the current tutorial, it has been downloaded to C:\sample-dropwizard-rest-stub. This application gets packaged to a single JAR file by mvn clean package. If instrumentation gets put in package phase then it is not working, as packaging happens before instrumentation. This is why test phase is the correct for the current example, as package includes test by default.

Instrument the code

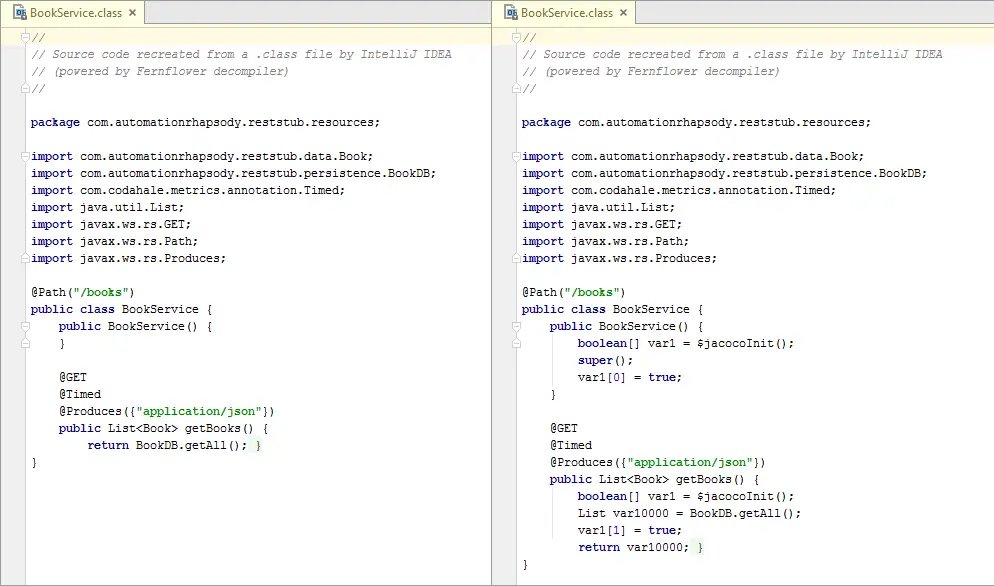
Once the application is downloaded it can be built with instrumentation with mvn clean package -Djacoco.skip.instrument=false command. You can easily check if given class has been instrumented by opening it with some kind of decompiler. The image below shows instrumented class on the right hand side vs non-instrumented in the left hand side.

JaCoCo-offline

Run it with JaCoCo agent in the class path

If not instrumented sample application is started with: java -jar target/sample-dropwizard-rest-stub-1.0-SNAPSHOT.jar server config.yml. In case of instrumented code this command will give exception:

Exception in thread “main” java.lang.NoClassDefFoundError: org/jacoco/agent/rt/internal_773e439/Offline

This is because jacocoagent.jar is not in the classpath.

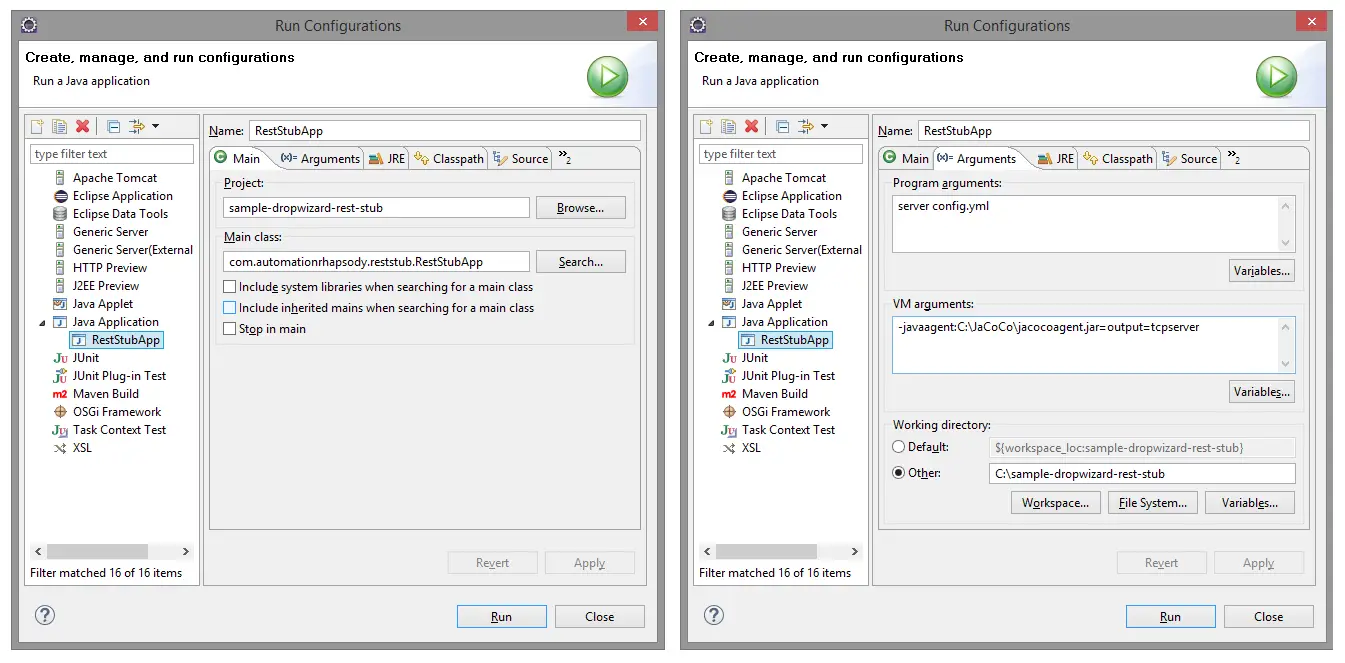
Adding JaCoCo agent in class path varies from case to case. In this particular tutorial application is a single JAR run by java -jar command. In order to add something in classpath java -cp command should be used. Problem is both -jar and -cp are mutually exclusive. Only way to do it is with the following command:

java -Djacoco-agent.output=tcpserver -cp C:\JaCoCo\jacocoagent.jar;target/sample-dropwizard-rest-stub-1.0-SNAPSHOT.jar com.automationrhapsody.reststub.RestStubApp server config.yml

Where -Djacoco-agent.output=tcpserver is configuration to make JaCoCo agent report on TCP port. More about JaCoCo Offline settings here. C:\JaCoCo\jacocoagent.jar is the location of the JaCoCo agent JAR file. com.automationrhapsody.reststub.RestStubApp is the main method to be run from target/sample-dropwizard-rest-stub-1.0-SNAPSHOT.jar file.

Test

Now when we have the application running is time to run all tests we have both automation and manual. For manual, it is important to be documented scenario which is reproducible on each regression testing, not just some random clicking. The idea is that we want to measure what coverage our tests do.

Import coverage results

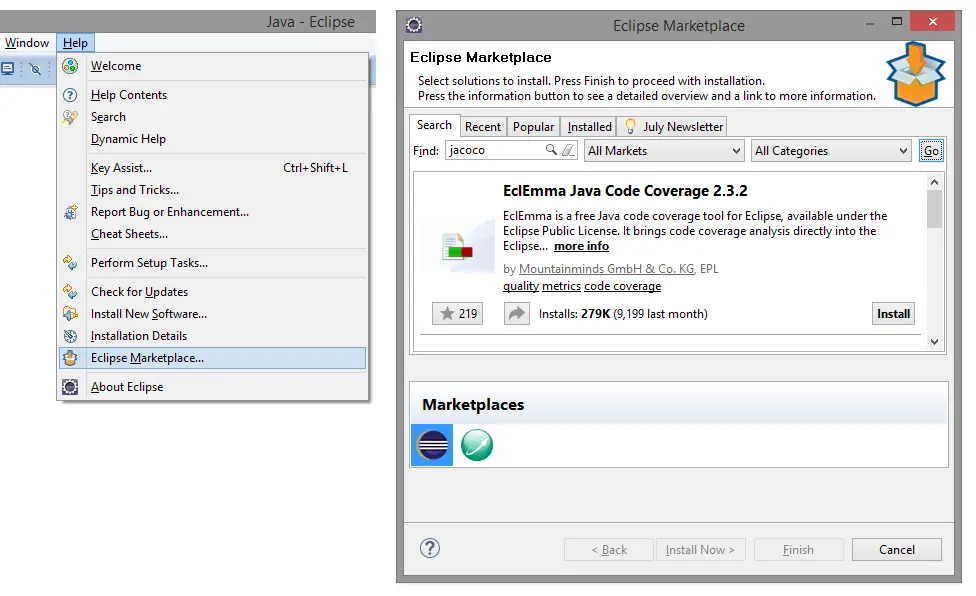
In order to import results Eclipse with installed JaCoCo plugin from market place is needed. See Code coverage of manual or automated tests with JaCoCo post for more details how to install the plugin.

Open Eclipse and import C:\sample-dropwizard-rest-stub project as Maven one.

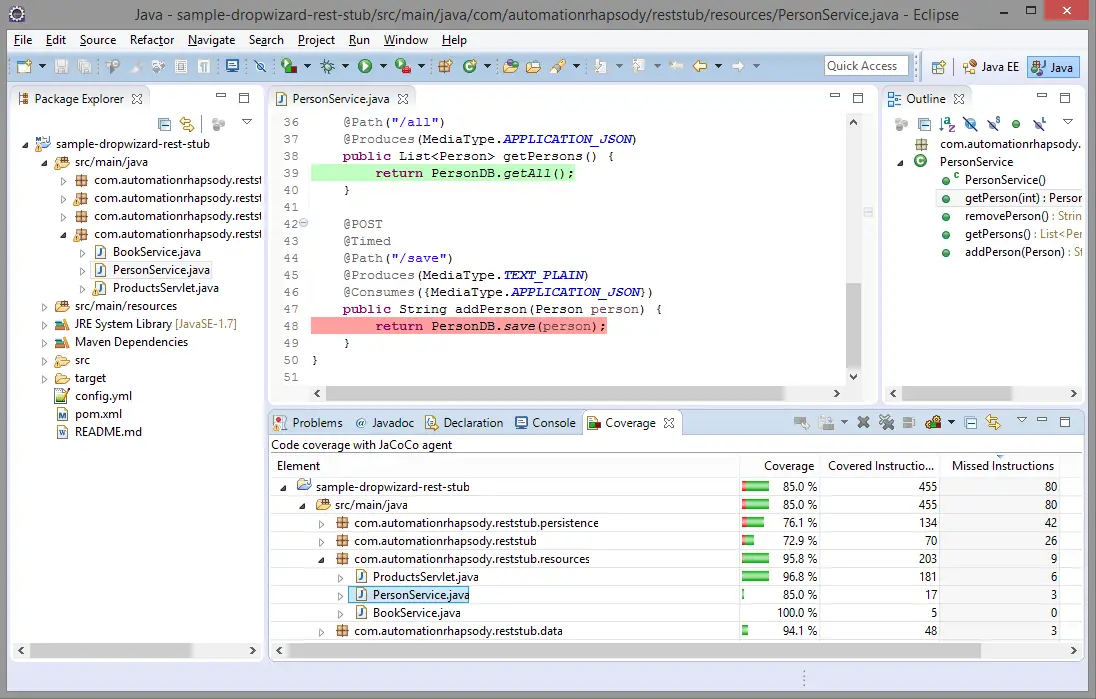
Import the results into Eclipse. This is done from File -> Import -> Coverage Session -> select Agent address radio button but leave defaults -> enter some name and select code under test.

JaCoCo-import

Once imported results can be seen and code gets highlighted.

In case no results are imported delete target\classes folder and rebuild with mvn compile.

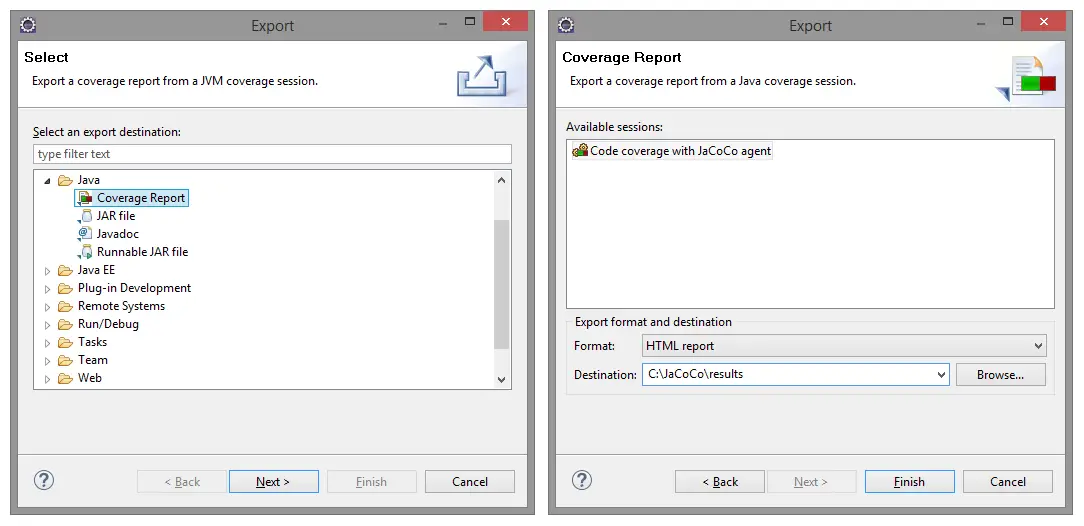
Export to HTML and analyze

See Code coverage of manual or automated tests with JaCoCo how to export and analyze.

Conclusion

Although very rare to happen offline instrumentation is a way to measure code coverage with JaCoCo.

Related Posts

Read more...

Automated code coverage of unit tests with JaCoCo and Maven

Last Updated on by

Post summary: Tutorial how to setup code coverage with JaCoCo on unit tests to be done on each Maven build.

Code coverage

There are two main streamlines in code coverage. One is running code coverage on each build measuring unit tests coverage. Once configured this needs no manual intervention. Depending on the tools there is even an option to fail the build if code coverage doesn’t reach the desired threshold. Current post is designated to this aspect. Other is running code coverage on automated or even manual functional tests scenarios. Latter is described in Code coverage of manual or automated tests with JaCoCo post.

Unit tests code coverage

The theory described in What about code coverage post is applicable for unit tests code coverage, but the real benefit of unit tests code coverage is:

  • Unit tests code coverage can be automated on every build
  • The build can be configured to fail if a specific threshold is not met

JaCoCo for Maven

There is JaCoCo plugin that is used with Maven builds. More details and what goals can be accomplished with it can be seen in JaCoCo Maven plugin page. The very minimum to make it work is to setup prepare-agent and report goals. Report goal is good to be called during test Maven task. This is done with test instruction. You can define it on other tasks, like install or package, however, code coverage is done for tests. XML block to be added to pom.xml file is:

<plugin>
	<groupId>org.jacoco</groupId>
	<artifactId>jacoco-maven-plugin</artifactId>
	<version>0.7.4.201502262128</version>
	<executions>
		<execution>
			<id>jacoco-initialize</id>
			<goals>
				<goal>prepare-agent</goal>
			</goals>
		</execution>
		<execution>
			<id>jacoco-report</id>
			<phase>test</phase>
			<goals>
				<goal>report</goal>
			</goals>
		</execution>
	</executions>
</plugin>

Once this is configured it can be run with mvn clean test command. Once successfully build JaCoCo report can be found in /target/site/jacoco/index.html file. A similar report can be found in HTML JaCoCo report.

Add coverage thresholds

Just adding unit tests code coverage report is good but can be rather improved. A good practice is to add code coverage thresholds. If predefined code coverage percentage is not reached build will fail. This practice could have a negative effect on putting unit tests just for the sake of code coverage, but then again it is up to the development team to keep the good quality. Adding thresholds is done with check Maven task:

<execution>
	<id>jacoco-check</id>
	<phase>test</phase>
	<goals>
		<goal>check</goal>
	</goals>
	<configuration>
		<rules>
			<rule implementation="org.jacoco.maven.RuleConfiguration">
				<element>BUNDLE</element>
				<limits>
					<limit implementation="org.jacoco.report.check.Limit">
						<counter>INSTRUCTION</counter>
						<value>COVEREDRATIO</value>
						<minimum>0.60</minimum>
					</limit>
				</limits>
			</rule>
		</rules>
	</configuration>
</execution>

check task should be added along with prepare-agent. report is not mandatory but could also be added in order to inspect where code coverage is not enough. Note that implementation attribute is mandatory only for Maven 2. If Maven 3 is used then attributes can be removed.

JaCoCo check rules

In order check task to work is should be added at least one goal element as shown above. The rule is defined for a particular scope. Available scopes are: BUNDLE, PACKAGE, CLASS, SOURCEFILE or METHOD. More details can be found in JaCoCo check Maven task documentation. In current example rule is for BUNDLE, which means whole code under analysis. PACKAGE is the far I would go. Even with it, there could be unpleasant surprises like a utility package or POJO (data object without business logic inside) packages where objects do not have essential business logic but the PACKAGE rule will still require given code coverage for this package. This means you will have to write unit tests just to satisfy the coverage demand.

JaCoCo check limits

Although not mandatory each rule is good to have at least one limit element as shown above.

Available limit counters are: INSTRUCTION, LINE, BRANCH, COMPLEXITY, METHOD, CLASS. Those are the values measured in the report. Some of them are JaCoCo specific other are accordance with code coverage general theory. See more details on counters in JaCoCo counters page. Check sample report at HTML JaCoCo report to see how counters are displayed.

Available limit values are: TOTALCOUNT, COVEREDCOUNT, MISSEDCOUNT, COVEREDRATIO, MISSEDRATIO. Those are the magnitude values for measuring. COUNT values are bounding with current implementation and cannot be referred to some industry standards. This is why RATIO values are much more suitable.

Actual measuring value is set in minimum or maximum elements. Minimum is generally used with COVERED values, maximum with MISSED values. Note that in case of RATIO this should be a double value less than 1, e.g. 0.60 in the example above means 60%.

With given counters and values there could be lots of combinations. The very minimum is to use INSTRUCTION with COVEREDRATIO as shown in the example above. Still, if you want to be really precise several limits with different counters can be used. Below is an example of Maven 3 where defining that every class should have been covered in unit tests:

<limit>
	<counter>CLASS</counter>
	<value>MISSEDCOUNT</value>
	<maximum>0</maximum>
</limit>

Configurations are good practice

Hard-coding is never a good practice anywhere. The example above has a hard-coded value of 60% instruction code coverage, otherwise build will fail. This is not a proper way to do it. The proper way is to define a property and then use it. Properties element is defined as a root level:

<properties>
	<jacoco.percentage.instruction>0.60</jacoco.percentage.instruction>
</properties>

...

<limit>
	<counter>INSTRUCTION</counter>
	<value>COVEREDRATIO</value>
	<minimum>${jacoco.percentage.instruction}</minimum>
</limit>

The benefit of a property is that it can be easily overridden at runtime, just specify the new value as a system property: mvn clean test -Djacoco.percentage.instruction=0.20. In this way, there could be a general value of 0.60 in pom.xml, but until this is not reached it can be overridden with 0.20.

Experiment with JaCoCo checks

Sample application to experiment with is the one introduced in Build a RESTful stub server with Dropwizard post. It can be found in GitHub sample-dropwizard-rest-stub repository. It has a very low amount of code in it and just one unit test with very low code coverage. This gives good opportunities to try different combinations of counters and values to see how exactly JaCoCo works.

Conclusion

Code coverage of unit tests with thresholds is a good practice. This tutorial gives very good introduction how to implement and use them, so apply and use them.

Related Posts

Read more...

Code coverage of manual or automated tests with JaCoCo

Last Updated on by

Post summary: Tutorial how to do code coverage on automated or even manual functional tests with JaCoCo.

Code coverage is a way to check what part of the code your tests are exercising. JaCoCo is a free code coverage library for Java.

Code coverage

There are two main streamlines in code coverage. One is running code coverage on each build measuring unit tests coverage. Once configured this needs no manual intervention. Depending on the tools there is even an option to fail the build if code coverage doesn’t reach the desired threshold. This is well described in Automated code coverage of unit tests with Maven and JaCoCo post. Another aspect is running code coverage on automated or even manual functional tests scenarios. This post is dedicated to latter. I have already created What about code coverage post to the theory of this type of code coverage. Current post is about getting it done in practice.

The idea

The idea is pretty simple. The application is started with a code coverage tool is attached to it, then tests are executed and results are gathered. This is it. Having stated it that way it doesn’t sound that bizarre to run code coverage on manual tests. Running it makes sense if only tests are well documented and repeatable scenarios that are usually run on regression testing.

JaCoCo Java agent

Java agent is powerful mechanism providing the ability to instrument and change classes at runtime. Java agent library is passed as a JVM parameter when running given application with -javaagent:{path_to_jar}. JaCoCo tool is implemented as Java agent. More details for Java agents can be found at java.lang.instrument package.

In case application under test does not support plugin agents to JVM then coverage can be measured with offline instrumentation described in Code coverage with JaCoCo offline instrumentation with Maven post.

Restrictions

Some restrictions that have to be taken into consideration:

  • JaCoCo plugin is only for Eclipse IDE, hence it should be used in order to get the report
  • Imported execution data must be based on the exact same class files that are also used within the Eclipse IDE, hence application should be run in Eclipse, it is not possible to build it and run it separately as class files will differ
  • Eclipse is not capable of shutting down the JVM, it directly kills it, hence the only way to get results is to start JaCoCo agent in tcpserver output mode
  • JaCoCo agent version 0.7.4 and Eclipse EclEmma plugin 2.3.2 are used, those are compatible, 0.7.5 introduces change in data format

Install Eclipse plugin

Having stated the restriction it is time to start. Installation is done through Eclipse -> Help -> Eclipse Marketplace… -> search for “jacoco” -> Install -> restart Eclipse.

JaCoCo-install

Run the application

As stated in restrictions in order code coverage to work application should be started in Eclipse. I will use sample application I have introduced in Build a RESTful stub server with Dropwizard post. It can be found in GitHub sample-dropwizard-rest-stub repository. For this tutorial, it is checked out to: C:\sample-dropwizard-rest-stub.

Download JaCoCo 0.7.4 agent jar. For this tutorial it is saved to C:\JaCoCo

Project have to imported to Eclipse from File -> Import -> Existing Maven projects. Once imported Run configuration have to be done from Run -> Run Configurations… -> double click Java Application. This opens new window to define configuration. Properties are stated below:

  • Name (Main tab): RestStubApp (could be whatever name)
  • Project (Main tab): sample-dropwizard-rest-stub
  • Main class (Main tab): com.automationrhapsody.reststub.RestStubApp
  • Program arguments (Arguments tab): server config.yml
  • VM arguments (Arguments tab): -javaagent:C:\JaCoCo\jacocoagent.jar=output=tcpserver (started in “tcpserver” output mode)
  • Working directory -> Other (Arguments tab): C:\sample-dropwizard-rest-stub

JaCoCo-run

Once the configuration is created then run it.

Apart from the given sample application, it should be possible to run every application in Eclipse. This assumption is made on the fact that developers do need to debug their application, so they will have a way to run it. The important part is to include -javaagent: part in VM arguments section

Test

Now when we have the application running is time to run all tests we have both automation and manual. For manual, it is important to be documented scenario which is reproducible in each regression testing, not just some random clicking. The idea is that we want to measure what coverage our tests do.

Import coverage results

After all tests have passed it is time to import the results into Eclipse. This is done from File -> Import -> Coverage Session -> select Agent address radio button but leave defaults -> enter some name and select code under test.

JaCoCo-import

Once imported results can be seen and code gets highlighted.

JaCoCo-results

Export to HTML

Now result can be exported. There are several options: HTML, zipped HTML, XML, CSV or JaCoCo execution data file. Export is done from: File -> Export -> Coverage Report -> select session and location.

JaCoCo-export

Analyse

Here comes the hard part. The code could be quite complex and not that easy to understand. In the current tutorial, code is pretty simple. Inspecting HTML JaCoCo report it can be easily noticed that addPerson() method has not been called. This leads to a conclusion that one test has been missed – to invoke all persons endpoint. Another finding is that ProductServlet hasn’t been tested with empty product id.

Conclusion

It is pretty easy to measure the code coverage. Whether to do it is another discussion held in What about code coverage post. If there is a time it might be beneficial. But do not make code coverage an important KPI as this could lead to aimless test with only one purpose – higher percentage. Code coverage should be done in order to optimize tests and search for gaps.

Related Posts

Read more...