Post summary: Important AWS CLI commands used in AWS examples in C#.
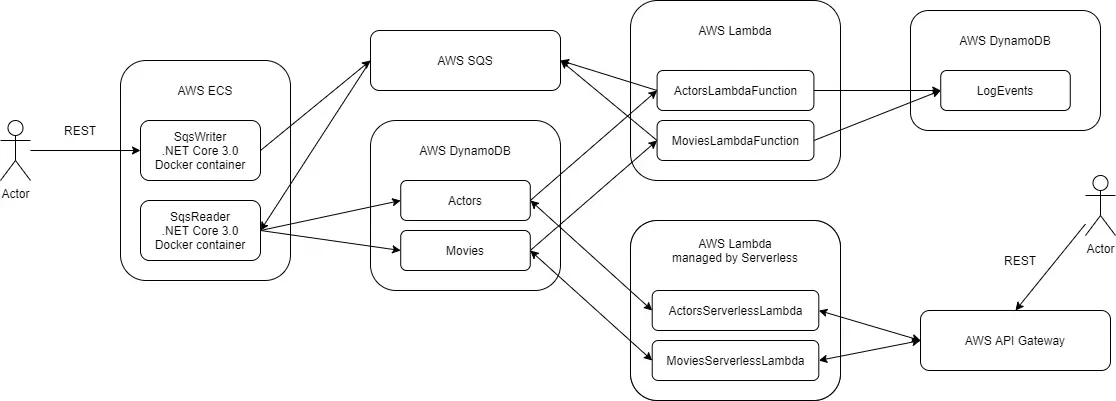
This post is part of AWS examples in C# – working with SQS, DynamoDB, Lambda, ECS series. The code used for this series of blog posts is located in aws.examples.csharp GitHub repository.
Introduction
In AWS examples in C# – run the solution post I have described how to install/uninstall current examples. In the current post, I am going to show in detail individual commands used. The configuration parameters in the command below will be given with capital letters and starting with a dollar sign, e.g. $CONFIGURATION_PARAMETER. Each AWS command has its code representation in the SDK for the desired programming language.
AWS Command Line Interface
The AWS Command Line Interface (CLI) is a unified tool to manage AWS services. Control of multiple AWS services from the command line and automate them through scripts can be done with just one tool to download and configure. The full list of services that can be controlled is listed in the AWS Command Line Interface reference page. Each service has a subpage with a list of all available commands. All commands return JSON as a response. In a subsequent post, I will describe how to manage the JSON in the command line. All operations in the current post are done after AWS credentials are set as environment variables:
export AWS_ACCESS_KEY_ID=KIA57FV4.....
export AWS_SECRET_ACCESS_KEY=mSgsxOWVh...
export AWS_DEFAULT_REGION=us-east-1
SQS operations
The full list can be found in aws sqs CLI reference page. More information about SQS can be found in AWS examples in C# – create a service working with SQS post.
Create
Initially, all queues are listed with list-queues, in order to check if the queue already exists.
aws sqs list-queues
The queue is created with create-queue command, the result of the command returns the queue URL.
aws sqs create-queue --queue-name $QUEUE_NAME
After queues are created, the re-drive policy has to be set up. The ARN of the dead-letter queue can be obtained with get-queue-attributes command by providing the queue URL.
aws sqs get-queue-attributes \
	--queue-url $DEAD_LETTER_QUEUE_URL \
	--attribute-names QueueArn
The re-drive policy is set with set-queue-attributes command.
aws sqs set-queue-attributes \
	--queue-url $QUEUE_URL \
	--attributes "{\"RedrivePolicy\":\"{\\\"maxReceiveCount\\\":\\\"3\\\",\\\"deadLetterTargetArn\\\":\\\"$DEAD_LETTER_QUEUE_ARN\\\"}\",\"ReceiveMessageWaitTimeSeconds\":\"$LONG_POLLING_TIMEOUT\"}"
Delete
In order to delete the queue, its URL is needed. The URL is obtained with get-queue-url command.
aws sqs get-queue-url --queue-name $QUEUE_NAME
Deletion happens with delete-queue command.
aws sqs delete-queue --queue-url $QUEUE_URL
DynamoDB operations
The full list can be found in aws dynamodb CLI reference page. More information about DynamoDB can be found in AWS examples in C# – create a service working with DynamoDB post.
Create
The table data is obtained with describe-table command.
aws dynamodb describe-table --table-name $TABLE_NAME
If the table does not exist, it is created with create-table command. The table command has all the data needed. See more about table attributes in AWS examples in C# – create a service working with DynamoDB post.
aws dynamodb create-table \
	--table-name $TABLE_NAME \
	--attribute-definitions 'AttributeName=FirstName,AttributeType=S' 'AttributeName=LastName,AttributeType=S' \
	--key-schema 'AttributeName=FirstName,KeyType=HASH' 'AttributeName=LastName,KeyType=RANGE' \
	--provisioned-throughput 'ReadCapacityUnits=5,WriteCapacityUnits=5' \
	--stream-specification 'StreamEnabled=true,StreamViewType=NEW_AND_OLD_IMAGES'
Delete
The table is deleted by name with delete-table command.
aws dynamodb delete-table --table-name $TABLE_NAME
IAM roles operations
The full list can be found in aws iam CLI reference page.
Create
Roles are listed with list-roles command to check if the role exists.
aws iam list-roles
The role is created with create-role command.
aws iam create-role \
	--role-name $ROLE_NAME \
	--assume-role-policy-document file://assume-role-policy-document.json
This is the only case in the current examples where an additional JSON document is needed alongside a command. It is not possible to pass this JSON inline as it is with aws sqs set-queue-attributes command. This JSON allows certain services to be accessed by this role.
{
	"Version": "2012-10-17",
	"Statement": [
		{
			"Effect": "Allow",
			"Principal": {
				"Service": [
					"lambda.amazonaws.com",
					"ec2.amazonaws.com",
					"ecs.amazonaws.com",
					"ecs-tasks.amazonaws.com",
					"batch.amazonaws.com"
				]
			},
			"Action": "sts:AssumeRole"
		}
	]
}
List policies to get the policy ARN with list-policies command. Basically, to make things easier, AdministratorAccess existing policy is used with its ARN.
aws iam list-policies
Attach the policy to the role with attach-role-policy command.
aws iam attach-role-policy \
	--role-name $ROLE_NAME \
	--policy-arn $POLICY_ARN
Delete
List policies with list-policies command to get the ARN, then detach the policy from the role.
aws iam detach-role-policy \
	--role-name $ROLE_NAME \
	--policy-arn $POLICY_ARN
After the policy is detached, role is deleted with delete-role command.
aws iam delete-role --role-name $ROLE_NAME
AWS Lambda operations
The full list can be found in aws lambda CLI reference page.
Create
List functions with list-functions command to check if the function exists.
aws lambda list-functions
Creating a function is done with create-function command and takes many arguments. Most of the parameters are self-explanatory. Timeout is important, the lambda function execution is suspended after the timeout passes, in current examples, it is 30 seconds, I found that cold start could take up to 15 seconds some times. The lambda configurations are described in AWS examples in C# – create basic Lambda function post.
aws lambda create-function \
	--function-name $FUNCTION_NAME \
	--runtime dotnetcore2.1 \
	--role $ROLE_ARN \
	--handler $HANDLER_STRING_WITH_NAMESPACE_CLASS_METHOD \
	--environment "Variables={AWS_SQS_QUEUE_NAME=$QUEUE_NAME, AWS_SQS_IS_FIFO=$IS_QUEUE_FIFO}" \
	--timeout $FUNCTION_TIMEOUT \
	--zip-file fileb://$PATH_TO_ZIP_FILE)
Once the function is created, it can be linked to an event source, such as DynamoDB. This happens by DynamoDB stream ARN. Once a record is inserted, updated or deleted in DynamoDB, the lambda function is called with this event.
aws lambda create-event-source-mapping \
	--function-name $FUNCTION_NAME \
	--event-source-arn $DYNAMODB_STREAM_ARN \
	--starting-position LATEST)
In case of function already exists, but its code has to be updated, this is done with update-function-code command.
aws lambda update-function-code \
	--function-name $FUNCTION_NAME \
	--zip-file fileb://$PATH_TO_ZIP_FILE)
Along with the code, function configuration can be updated as well with update-function-configuration command.
aws lambda update-function-configuration \
	--function-name $FUNCTION_NAME  \
	--role $ROLE_ARN\
	--handler $HANDLER_STRING_WITH_NAMESPACE_CLASS_METHOD  \
	--environment "Variables={AWS_SQS_QUEUE_NAME=$QUEUE_NAME, AWS_SQS_IS_FIFO=$IS_QUEUE_FIFO}" \
	--timeout $FUNCTION_TIMEOUT
Delete
In order to delete, then the event source UUID has to be obtained, this is done with list-event-source-mappings command.
aws lambda list-event-source-mappings --function-name $FUNCTION_NAME
Then event source mapping is deleted with delete-event-source-mapping command.
aws lambda delete-event-source-mapping --uuid $EVNET_SOURCE_UUID
And finally, the function itself is deleted with delete-function command.
aws lambda delete-function --function-name $FUNCTION_NAME
ECS (Elastic Container Service) operations
The full list can be found in aws ecs CLI reference page.
Create
Before doing anything with ECR, docker login command should be created with get-login, so docker is authenticated with AWS ECR. With eval function, the docker login command is directly executed.
eval $(aws ecr get-login --no-include-email)
Clusters are first listed, in order to evaluate if the application is already deployed.
aws ecs list-clusters
Cluster is created with create-cluster command. A cluster consists of services.
aws ecs create-cluster --cluster-name $CLUSTER_NAME
Existing task definitions are listed, to evaluate whether they are published or not. Task definitions are Docker configurations.
aws ecs describe-task-definition --task-definition $TASK_DEFINITION_NAME
Task definition is created with register-task-definition command.
aws ecs register-task-definition \
	--family $TASK_DEFINITION_NAME \
	--execution-role-arn $ROLE_ARN\
	--network-mode awsvpc \
	--container-definitions $CONTAINER_DEFINITIONS \
	--requires-compatibilities "FARGATE" \
	--cpu "256" \
	--memory "512"
$CONTAINER_DEFINITIONS is a Docker configuration which defines the task definition:
name=$TASK_DEFINITION_NAME,\
image=$IMAGE_TAG,\
environment=[\
	{name=AwsQueueIsFifo,value=$_IS_QUEUE_FIFO},\
	{name=AwsRegion,value=$REGION},\
	{name=AwsQueueName,value=$QUEUE_NAME},\
	{name=AwsAccessKey,value=$AWS_ACCESS_KEY},\
	{name=AwsSecretKey,value=$AWS_SECRET_KEY},\
	{name=AwsQueueAutomaticallyCreate,value=$AWS_QUEUE_AUTO_CREATE},\
	{name=AwsQueueLongPollTimeSeconds,value=$AWS_POLL_TIME_SECONDS}\
],\
logConfiguration={\
	logDriver=awslogs,\
	options={\
		awslogs-group=ecs/$SERVICE_NAME,\
		awslogs-region=$REGION,\
		awslogs-stream-prefix=ecs\
	}\
}
Before creating a service, existing ones are listed with describe-services command. Service has one or more running instances of a task definition. This is how service can scale.
aws ecs describe-services \
	--cluster $CLUSTER_NAME\
	--services $SERVICE_NAME
Creating a service is done with create-service command. $TASK_REVISION is the result of the register-task-definition command. $SUBNET_ID is returned by aws ec2 describe-subnets command.
aws ecs create-service --cluster $CLUSTER_NAME \
	--service-name $SERVICE_NAME \
	--task-definition "$TASK_DEFINITION_NAME:$TASK_REVISION" \
	--desired-count 1 \
	--launch-type "FARGATE" \
	--network-configuration "awsvpcConfiguration={subnets=[$SUBNET_ID],securityGroups=[$SECURITY_GROUP_ID],assignPublicIp=ENABLED}")
Updating of the service is done with a very update-service similar command.
aws ecs update-service --cluster $CLUSTER_NAME \
	--service $SERVICE_NAME \
	--task-definition "$TASK_DEFINITION_NAME:$TASK_REVISION" \
	--desired-count 1 \
	--network-configuration "awsvpcConfiguration={subnets=[$SUBNET_ID],securityGroups=[$SECURITY_GROUP_ID],assignPublicIp=ENABLED}")
Delete
In order to delete task definitions, they should be first listed with list-task-definitions command, so the task definition version is available.
aws ecs list-task-definitions
Removing of the task definition is done with deregister-task-definition command. Note that the command does what it says, deregister, it does not delete. The task definition is kept in history in status INACTIVE.
aws ecs deregister-task-definition --task-definition "$TASK_DEFINITION_VERSION"
Deleting the service is done with the delete-service command, the –force parameter also stops the running tasks.
aws ecs delete-service \
	--cluster $CLUSTER_NAME \
	--service $SERVICE_NAME \
	--force
In the end, the whole cluster is deleted with delete-cluster command.
aws ecs delete-cluster --cluster $CLUSTER_NAME
ECR (Elastic Container Registry) operations
The full list can be found in aws ecr CLI reference page.
Delete
The repository is created by Docker when the image is pushed to it. Repository and images inside are deleted with delete-repository command.
aws ecr delete-repository \
	--repository-name $REPOSITORY_NAME \
	--force
EC2 (Elastic Compute Cloud) operations
The full list can be found in aws ec2 CLI reference page.
Create
EC2 is responsible for security groups, which expose the service to the world by applying firewall rules. Before creating the group, it is first searched for presence with describe-security-groups command.
aws ec2 describe-security-groups
The security group is created with create-security-group command.
aws ec2 create-security-group \
	--description $SECIRITY_GROUP_DESCRIPTION\
	--group-name $SECIRITY_GROUP_NAME
Inbound rules are defined with authorize-security-group-ingress command, where ip_permission is a bash function generation the JSON for better reuse.
aws ec2 authorize-security-group-ingress \
	--group-id $SECURITY_GROUP_ID \
	--ip-permissions "[$(ip_permission $SERVICE_PORT)]"
Function generation firewall rule JSON, $1 is an argument given to the function.
function ip_permission() {
	echo "{\"IpProtocol\": \"tcp\", \"FromPort\": $1, \"ToPort\": $1, \"IpRanges\": [{\"CidrIp\": \"0.0.0.0/0\", \"Description\": \"Port $1\"}]}"
}
Subnets are listed with describe-subnets command. Each subnet has 3 availability zones.
aws ec2 describe-subnets
Finally, in order to report the IP of the deployed service, describe-network-interfaces command is used.
aws ec2 describe-network-interfaces --filters "Name=network-interface-id,Values=$networkInterfaceId"
Delete
A security group is deleted by name with delete-security-group command.
aws ec2 delete-security-group --group-name $SECURITY_GROUP
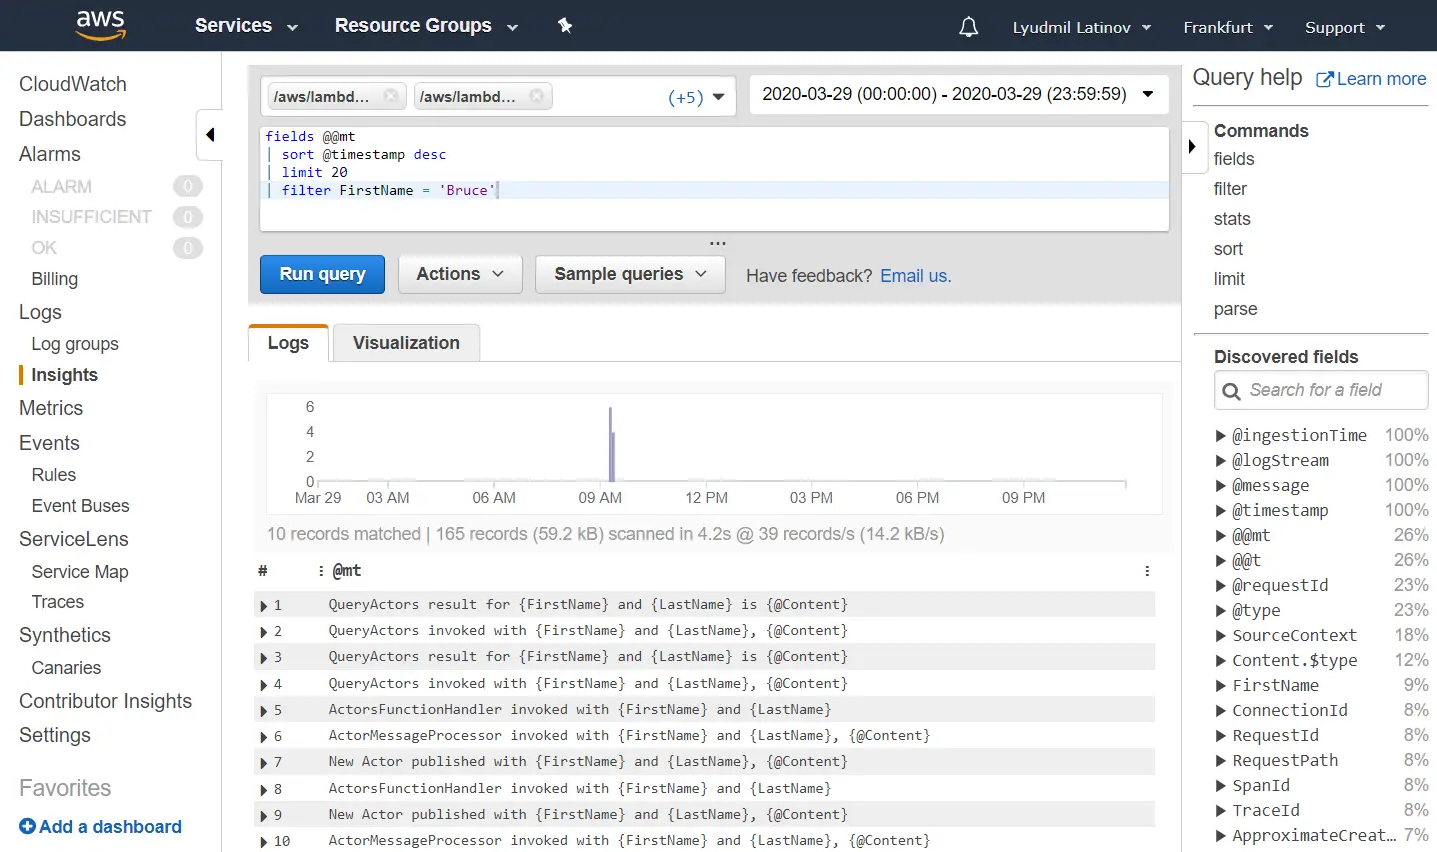
CloudWatch operations
The full list can be found in aws logs CLI reference page.
Delete
CloudWatch logs are created by default from the services. Deleting the logs is done with delete-log-group command. Note that I am using Git Bash on Windows and MSYS_NO_PATHCONV=1 is mandatory because the log group name starts with /.
MSYS_NO_PATHCONV=1 aws logs delete-log-group --log-group-name ecs/$SERVICE_NAME
Conclusion
AWS command-line interface provides tooling to handle all needed operations of the AWS services. It is the preferred way to manage services over the Web user interface.
Related Posts