Post summary: Examples how to do code coverage of manual or automated functional test with OpenCover tool for .NET applications
Code coverage
This topic is how to do the code coverage on .NET applications with OpenCover. Theory on what is code coverage, why it is needed can be found in What about code coverage post.
OpenCover
OpenCover is open source tool for code coverage for .NET 2.0 and above applications for Windows only. With OpenCover instrumentation of the code is not needed. The application is started through OpenCover and it collects coverage results. What is mandatory though is PDB file along with executables and assemblies, so application under test should be built in Debug mode. If PDB file is not found then no coverage data will be gathered.
The latest version can be downloaded form Releases in GitHub. There are installer and zip archive. If the installer is used by default OpenCover is installed in C:\Users\{USER_ACCOUNT}\AppData\Local\Apps\OpenCover. If you want to change this, click Advanced button during installation and then select Install for all users on this machine.
How to use OpenCover
Usage guide can be found in OpenCover usage reference online. Also along with OpenCover installation, there is Usage.rft file which holds all the information about the tool. Most useful commands are listed below:
- -target:<path to target> – the path to application executable file or name of service
- -filter:<filters> – list of filters to apply to selectively include or exclude assemblies and classes from coverage results
- -output:<output file> – the path to output XML file, if empty then results.xml will be created the in the current directory
- -register[:user] – register and de-register the code coverage profiler
- -targetargs:<target arguments> – arguments to be passed to the target process
- -targetdir:<target directory> – path to the target directory or alternative path to PDB files
ReportGenerator
OpenCover produces results in raw format, which is not for humans. ReportGenerator is used to convert XML reports generated by OpenCover, PartCover, Visual Studio or NCover into human readable reports in various formats. Usage guide can be found on its home page, most useful commands are:
- -reports:<report> – coverage reports that should be parsed, semicolon separated, wildcards are allowed
- -targetdir:<target directory> – directory where the generated report should be saved
- -sourcedirs:<directory>[;<directory>][;<directory>] – directories which contain the corresponding source code, optional, semicolon separated
- -classfilters:<(+|-)filter>[;<(+|-)filter>][;<(+|-)filter>] – list of classes that should be included or excluded in the report, optional, wildcards are allowed.
Hands on examples on manual code coverage
In order to try you need to checkout code samples from GitHub SampleApp or SampleAppPlus repository to C:\. Telerik Testing Framework needs to be installed as it copies lots of assemblies in GAC. OpenCover and ReportGenerator should also be installed to C:\.
With current setup command to start SimpleAppPlus.exe from OpenCover is:
C:\OpenCover\OpenCover.Console.exe `
	-target:"C:\SampleAppPlus\SampleAppPlus\bin\Debug\SampleAppPlus.exe" `
	-output:C:\SampleAppPlus\CoverageReports\SampelAppPlus.results.xml `
	-register:user
Now the application is started and manual functional tests can be executed. Once the application is stopped coverage results are saved in SampelAppPlus.results.xml file.
Hands on examples on automated code coverage
Since automation is the future of QA and we have already created automated tests for both SimpleApp and SimplaAppPlus, we want to measure how our tests perform on code coverage. Automated tests run the application, attach to it and manipulate it. So it seems close to mind just to use the command from manual example and start the application with it. It will not work though since the command is starting and returning OpenCover process, not underlying SimpleAppPlus one. Extra code is needed in SampleAppPlus.Tests.Framework\Tests\BaseTest.cs file. Instead of:
Application appWhite = Application.Launch(applicationPath);
following code has to be added:
Process sampleAppPlus = StartProcess();
Application appWhite = Application.Attach(sampleAppPlus);
where StartProcess() method is:
using System;
using System.Collections.Generic;
using System.Diagnostics;
using System.Linq;
using System.Threading;

private Process StartProcess()
{
	string appName = "SampleAppPlus";
	string openCover = @"C:\OpenCover\OpenCover.Console.exe";
	long timeStamp = (long)(DateTime.UtcNow
						- new DateTime(1970, 1, 1)).TotalMilliseconds;

	List<string> arguments = new List<string>();
	arguments.Add(@"-target:C:\SampleAppPlus\SampleAppPlus\bin\Debug\"
					+ appName + ".exe");
	arguments.Add(@"-output:C:\SampleAppPlus\CoverageReports\SampelAppPlus."
					+ timeStamp + ".xml");
	arguments.Add("-register:user");

	Process process = new Process();
	process.StartInfo.FileName = openCover;
	process.StartInfo.Arguments = string.Join(" ", arguments);
	process.Start();

	Thread.Sleep(5000);
	return Process.GetProcesses().First(proc => appName == proc.ProcessName);
}
OpenCover arguments “-target”, “-output” and “-register” are used. Note that -output file is always different by adding current unix time in the file name, this is to prevent overwriting of the file. The idea is to run OpenCover which will start SimpleAppPlus. Wait 5 seconds to ensure the application is up, then get all Windows processes with Process.GetProcesses(), iterate them, find and return the needed SampleAppPlus process which TestStack.White and Telerik Testing Framework will attach to.
Create report
Once tests are run and OpenCover XML report files are generated it is time to generated human readable reports. This is done with ReportGenerator with the command:
C:\ReportGenerator\bin\ReportGenerator.exe `
	-reports:C:\SampleAppPlus\CoverageReports\SampelAppPlus.*.xml `
	-targetdir:C:\SampleAppPlus\CoverageReports\html `
	-sourcedirs:C:\SampleAppPlus\ `
	-classfilters:-SampleAppPlus.Properties.*
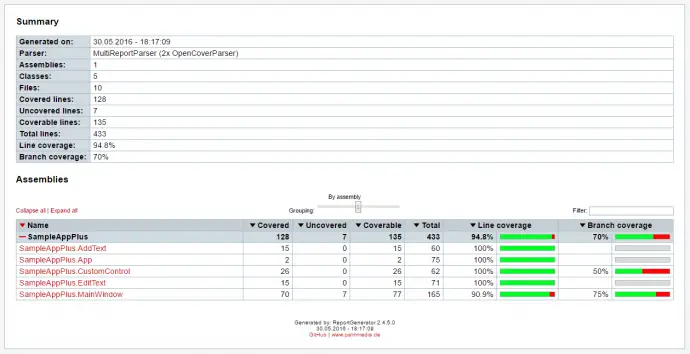
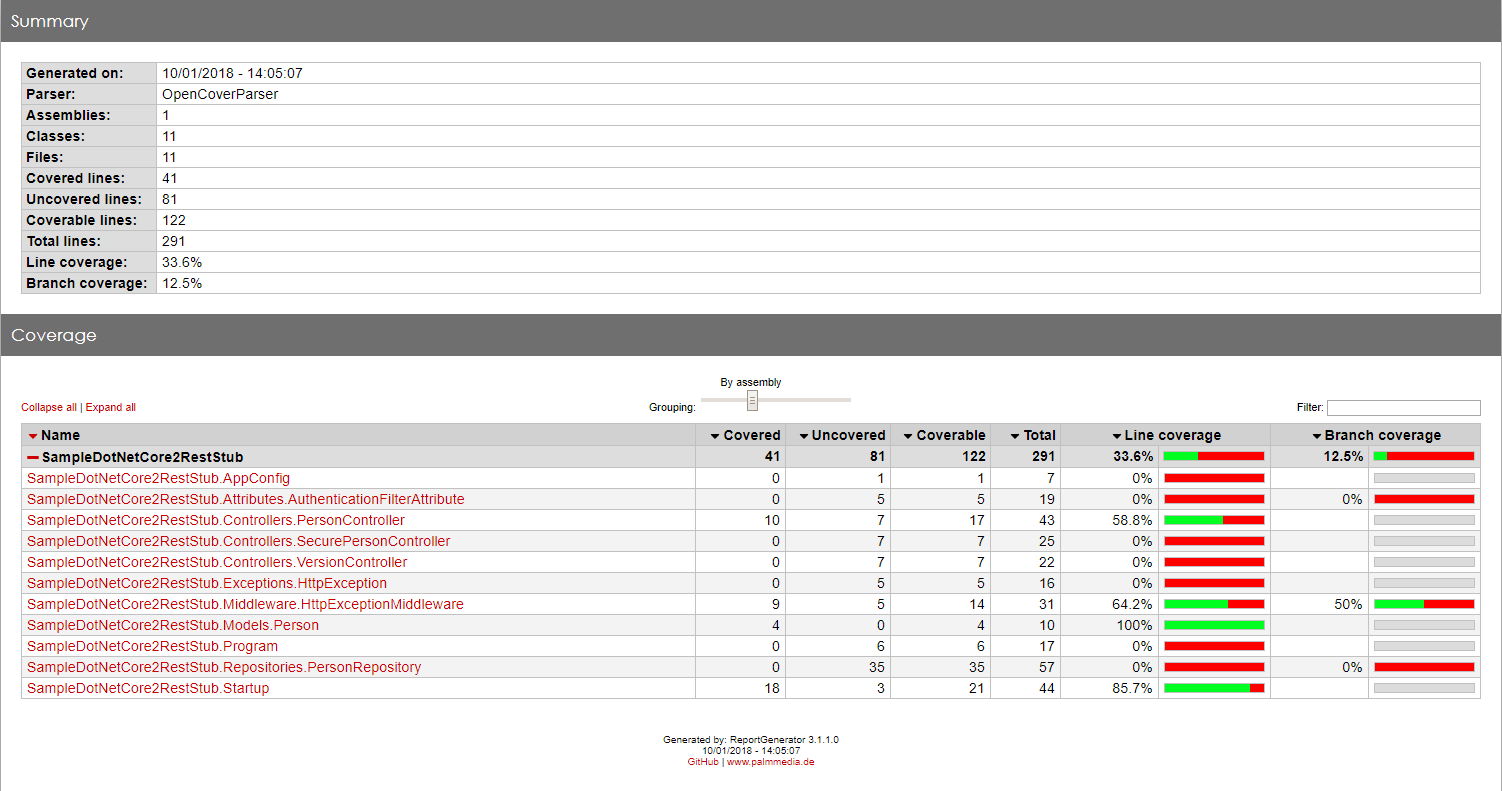
Inspect report
Coverage report file from examples above can be found in OpenCover code coverage report. Inspecting the report there is missed code in SampleAppPlus.MainWindow class – else branch of if ((bool)openFileDialog.ShowDialog()) condition is not covered. Documentation of this method states that it returns false if Cancel button is clicked of the dialog window. In order to increase the coverage test that clicks Cancel button and verifies no upload is done should be added to test suite.
Code coverage for IIS web application or Windows service
Examples above show how to run a normal windows application. It is valid for both UI and console applications as they are started with single EXE file. OpenCover can also work for IIS web applications, Silverlight applications and Windows service applications. More details can be found in documentation accompanying OpenCover installation.
Although it is possible to connect to a running service, I have done code coverage on Windows service in the manner suggested in the documentation – run the service as a console application. Since debugging a running Windows service is not that straightforward task, developers have most likely already implemented a switch to start service as a console application. If not you will easy their lives by asking them to do so.
Conclusion
OpenCover is the only open source tool for code coverage for .NET applications. It is really powerful and easy to use. No code instrumentation is needed, just build the code into Debug mode to have PDB files and run the application through OpenCover. It can also be used for measuring code coverage of unit tests.
Related Posts