Post summary: Instrument Cypress tests with OpenTelemetry and be able to custom trace the tests.
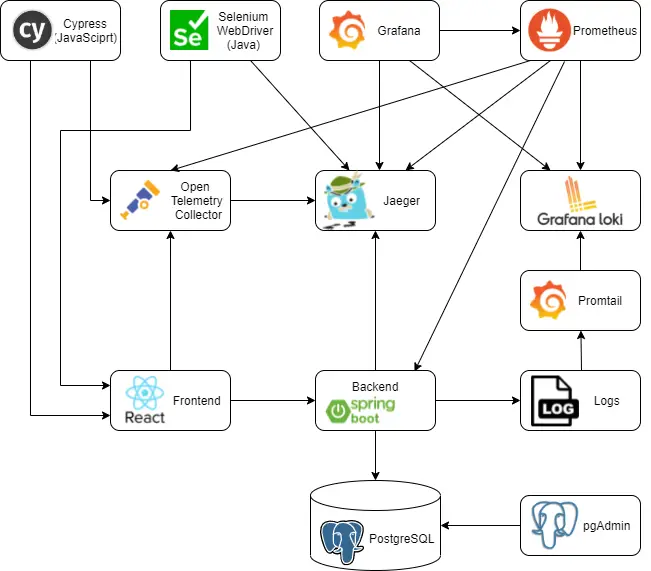
This post is part of Distributed system observability: complete end-to-end example series. The code used for this series of blog posts is located in selenium-observability-java GitHub repository.
Cypress
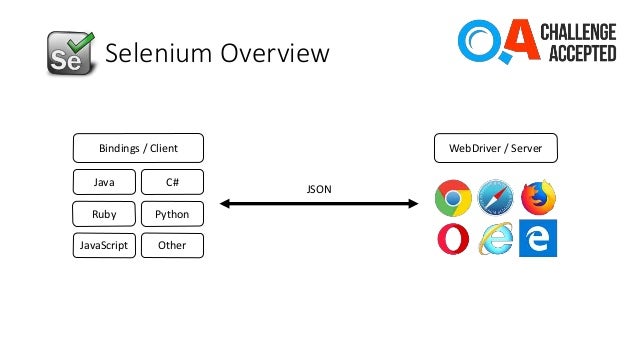
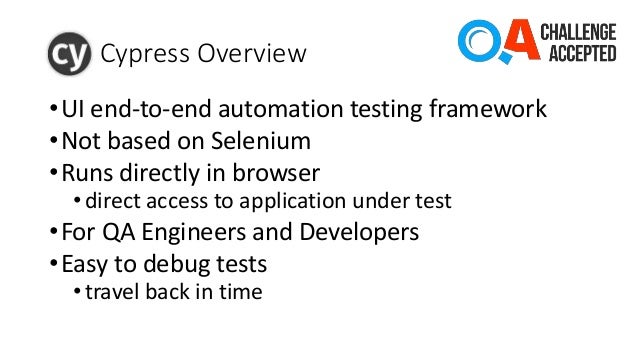
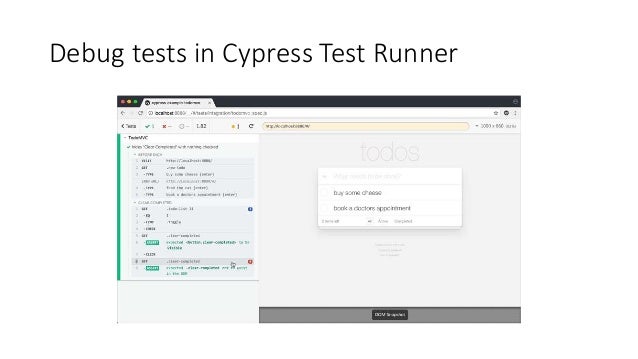
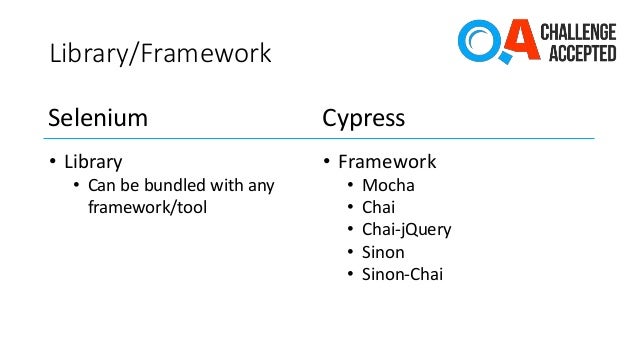
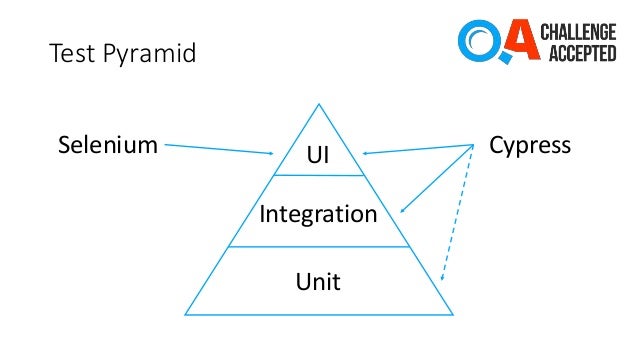
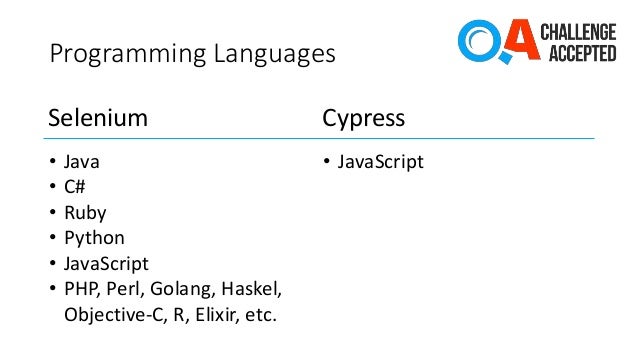
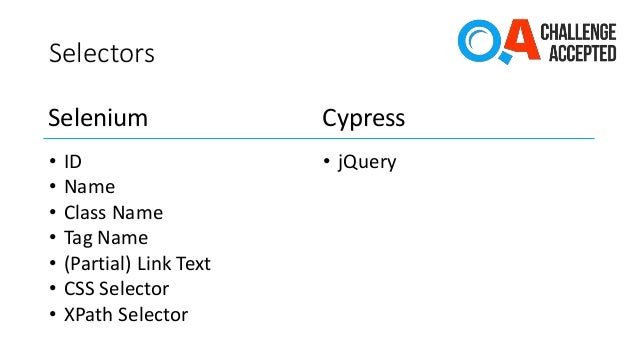
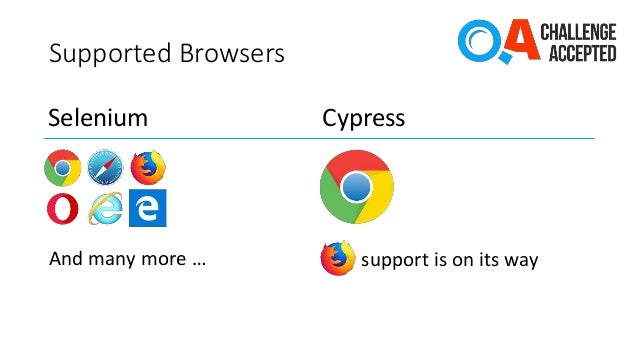
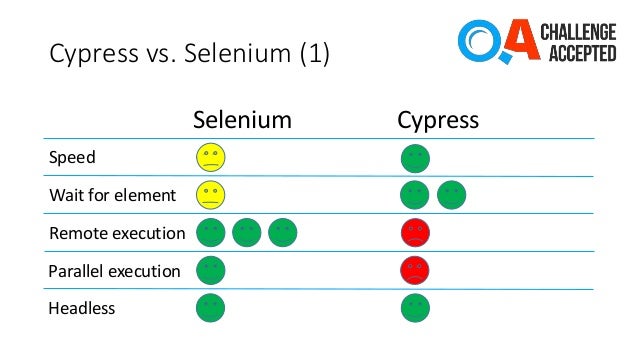
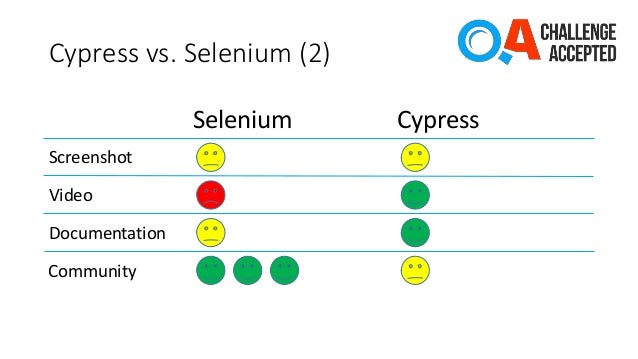
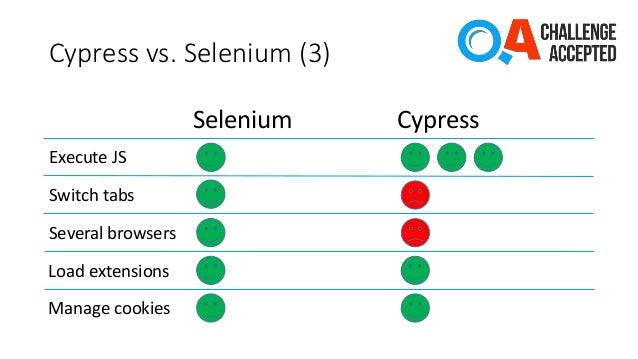
Cypress is a front-end testing tool built for the modern web. It is most often compared to Selenium; however, Cypress is both fundamentally and architecturally different. I have lots of experience with Cypress, I have written for it in Testing with Cypress – lessons learned in a complete framework post. Although it provides some benefits over Selenium, it also comes with its problems. Writing tests in Cypress is more complex than with Selenium. Cypress is more technically complex, which gives more power but is a real struggle for making decent test automation.
Cypress tests custom observability
As stated before, in the case of HTTP calls, the OpenTelemetry binding between both parties is the traceparent header. I want to bind the Selenium tests with the frontend, so it comes naturally to mind – open the URL in the browser and provide this HTTP header. After research, I could not find a way to achieve this. I implemented a custom solution, which is Cypress independent and can be customized as needed. Moreover, it is a web automation framework independent, this approach can be used with any web automation tool. See examples for the same approach in Selenium in Distributed system observability: Instrument Selenium tests with OpenTelemetry post.
Instrument the frontend
In order to achieve linking, a JavaScript function is exposed in the frontend, which creates a parent Span. Then this JS function is called from the tests when needed. This function is named startBindingSpan() and is registered with the window global object. It creates a binding span with the same attributes (traceId, spanId, traceFlags) as the span used in the Selenium tests. This span never ends, so is not recorded in the traces. In order to enable this span, the traceSpan() function has to be manually used in the frontend code, because it links the current frontend context with the binding span. I have added another function, called flushTraces(). It forces the OpenTelemetry library to report the traces to Jaeger. Reporting is done with an HTTP call and the browser should not exit before all reporting requests are sent.
Note: some people consider exposing such a window-bound function in the frontend to modify React state as an anti-pattern. Frontend code is in src/helpers/tracing/index.ts:
declare const window: any
var bindingSpan: Span | undefined

window.startBindingSpan = (traceId: string, spanId: string, traceFlags: number) => {
  bindingSpan = webTracerWithZone.startSpan('')
  bindingSpan.spanContext().traceId = traceId
  bindingSpan.spanContext().spanId = spanId
  bindingSpan.spanContext().traceFlags = traceFlags
}

window.flushTraces = () => {
  provider.activeSpanProcessor.forceFlush().then(() => console.log('flushed'))
}

export function traceSpan<F extends (...args: any)
    => ReturnType<F>>(name: string, func: F): ReturnType<F> {
  var singleSpan: Span
  if (bindingSpan) {
    const ctx = trace.setSpan(context.active(), bindingSpan)
    singleSpan = webTracerWithZone.startSpan(name, undefined, ctx)
    bindingSpan = undefined
  } else {
    singleSpan = webTracerWithZone.startSpan(name)
  }
  return context.with(trace.setSpan(context.active(), singleSpan), () => {
    try {
      const result = func()
      singleSpan.end()
      return result
    } catch (error) {
      singleSpan.setStatus({ code: SpanStatusCode.ERROR })
      singleSpan.end()
      throw error
    }
  })
}
Instrument Cypress tests
In order to achieve the tracing, OpenTelemetry JavaScript libraries are needed. Those libraries are the same used in the frontend and described in Distributed system observability: Instrument React application with OpenTelemetry post. Those libraries send the data in OpenTelemetry format, so OpenTelemetry Collector is needed to convert the traces into Jaeger format. OpenTelemetry collector is already started into the Docker compose landscape, so it just needs to be used, its endpoint is http://localhost:4318/v1/trace. There is a function that creates an OpenTelemetry tracer. I have created two implementations on the tracing. One is by extending the existing Cypress commands. Another is by creating a tracing wrapper around Cypress. Both of them use the tracer creating function. Both of them coexist in the same project, but cannot run simultaneously.
import { WebTracerProvider } from '@opentelemetry/sdk-trace-web'
import { Resource } from '@opentelemetry/resources'
import { SimpleSpanProcessor } from '@opentelemetry/sdk-trace-base'
import { CollectorTraceExporter } from '@opentelemetry/exporter-collector'
import { ZoneContextManager } from '@opentelemetry/context-zone'

export function initTracer(name) {
  const resource = new Resource({ 'service.name': name })
  const provider = new WebTracerProvider({ resource })

  const collector = new CollectorTraceExporter({
    url: 'http://localhost:4318/v1/trace'
  })
  provider.addSpanProcessor(new SimpleSpanProcessor(collector))
  provider.register({ contextManager: new ZoneContextManager() })

  return provider.getTracer(name)
}
Tracing Cypress tests – override default commands
Cypress allows you to overwrite existing commands. This feature will be used in order to do the tracing, commands will perform their normal functions, but also will trace. This is achieved in cypress-tests/cypress/support/commands_tracing.js file.
import { context, trace } from '@opentelemetry/api'
import { initTracer } from './init_tracing'

const webTracerWithZone = initTracer('cypress-tests-overwrite')

var mainSpan = undefined
var currentSpan = undefined
var mainWindow

function initTracing(name) {
  mainSpan = webTracerWithZone.startSpan(name)
  currentSpan = mainSpan
  trace.setSpan(context.active(), mainSpan)
  mainSpan.end()
}

function initWindow(window) {
  mainWindow = window
}

function createChildSpan(name) {
  const ctx = trace.setSpan(context.active(), currentSpan)
  const span = webTracerWithZone.startSpan(name, undefined, ctx)
  trace.setSpan(context.active(), span)
  return span
}

Cypress.Commands.add('initTracing', name => initTracing(name))

Cypress.Commands.add('initWindow', window => initWindow(window))

Cypress.Commands.overwrite('visit', (originalFn, url, options) => {
  currentSpan = mainSpan
  const span = createChildSpan(`visit: ${url}`)
  currentSpan = span
  const result = originalFn(url, options)
  span.end()
  return result
})

Cypress.Commands.overwrite('get', (originalFn, selector, options) => {
  const span = createChildSpan(`get: ${selector}`)
  currentSpan = span
  const result = originalFn(selector, options)
  span.end()
  mainWindow.startBindingSpan(span.spanContext().traceId,
    span.spanContext().spanId, span.spanContext().traceFlags)
  return result
})

Cypress.Commands.overwrite('click', (originalFn, subject, options) => {
  const span = createChildSpan(`click: ${subject.selector}`)
  const result = originalFn(subject, options)
  span.end()
  return result
})

Cypress.Commands.overwrite('type', (originalFn, subject, text, options) => {
  const span = createChildSpan(`type: ${text}`)
  const result = originalFn(subject, text, options)
  span.end()
  return result
})
This file with commands overwrite can be conditionally enabled and disabled with an environment variable. Variable is enableTracking and is defined in cypress.json file. This allows switching tracing on and off. In cypress.json file there is one more setting, chromeWebSecurity which overrides the CORS problem when tracing is sent to the OpenTelemetry collector. Cypress get command is the one that is used to do the linking between the tests and the frontend. It is calling the window.startBindingSpan function. In order for this to work, a window instance has to be set into the tests with the custom initWindow command.
Note: A special set of Page Objects is used with this implementation.
Tracing Cypress tests – implement a wrapper
Cypress allows you to overwrite existing commands. This feature will be used in order to do the tracing, commands will perform their normal functions, but also will trace. This is achieved in cypress-tests/cypress/support/tracing_cypress.js file.
import { context, trace } from '@opentelemetry/api'
import { initTracer } from './init_tracing'

export default class TracingCypress {
  constructor() {
    this.webTracerWithZone = initTracer('cypress-tests-wrapper')
    this.mainSpan = undefined
    this.currentSpan = undefined
  }

  _createChildSpan(name) {
    const ctx = trace.setSpan(context.active(), this.currentSpan)
    const span = this.webTracerWithZone.startSpan(name, undefined, ctx)
    trace.setSpan(context.active(), span)
    return span
  }

  initTracing(name) {
    this.mainSpan = this.webTracerWithZone.startSpan(name)
    this.currentSpan = this.mainSpan
    trace.setSpan(context.active(), this.mainSpan)
    this.mainSpan.end()
  }

  visit(url, options) {
    this.currentSpan = this.mainSpan
    const span = this._createChildSpan(`visit: ${url}`)
    this.currentSpan = span
    const result = cy.visit(url, options)
    span.end()
    return result
  }

  get(selector, options) {
    const span = this._createChildSpan(`get: ${selector}`)
    this.currentSpan = span
    const result = cy.get(selector, options)
    span.end()
    return result
  }

  click(subject, options) {
    const span = this._createChildSpan('click')
    subject.then(element =>
      element[0].ownerDocument.defaultView.startBindingSpan(
        span.spanContext().traceId,
        span.spanContext().spanId,
        span.spanContext().traceFlags
      )
    )
    const result = subject.click(options)
    span.end()
    return result
  }

  type(subject, text, options) {
    const span = this._createChildSpan(`type: ${text}`)
    const result = subject.type(text, options)
    span.end()
    return result
  }
}
In order to make this implementation work, it is mandatory to set enableTracking variable in cypress.json file to false. TracingCypress is instantiated in each and every test. An instance of it is provided as a constructor argument to the Page Object for this approach. The important part here is that the binding window.startBindingSpan is called in the get() method.
Note: A special set of Page Objects is used with this implementation.
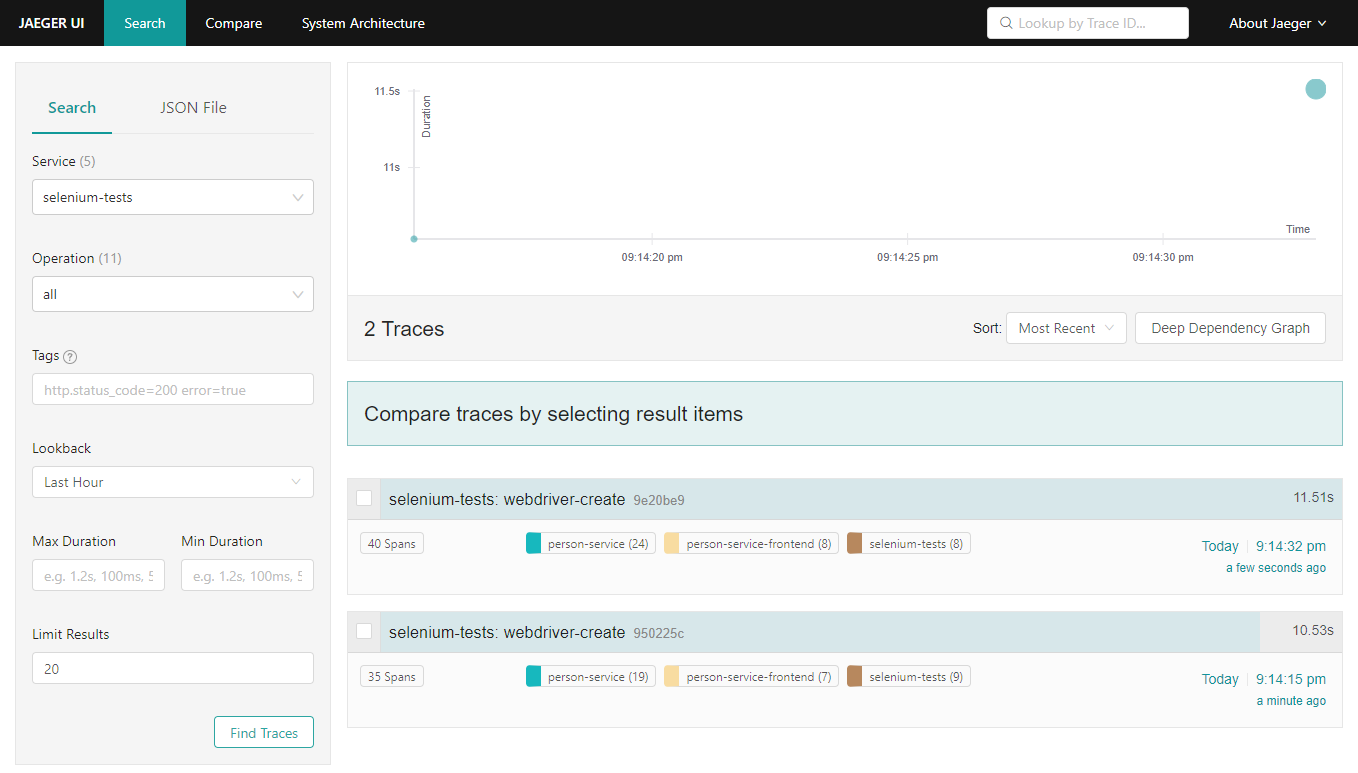
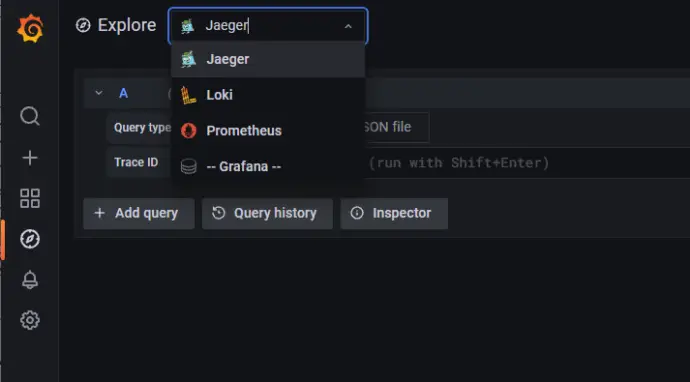
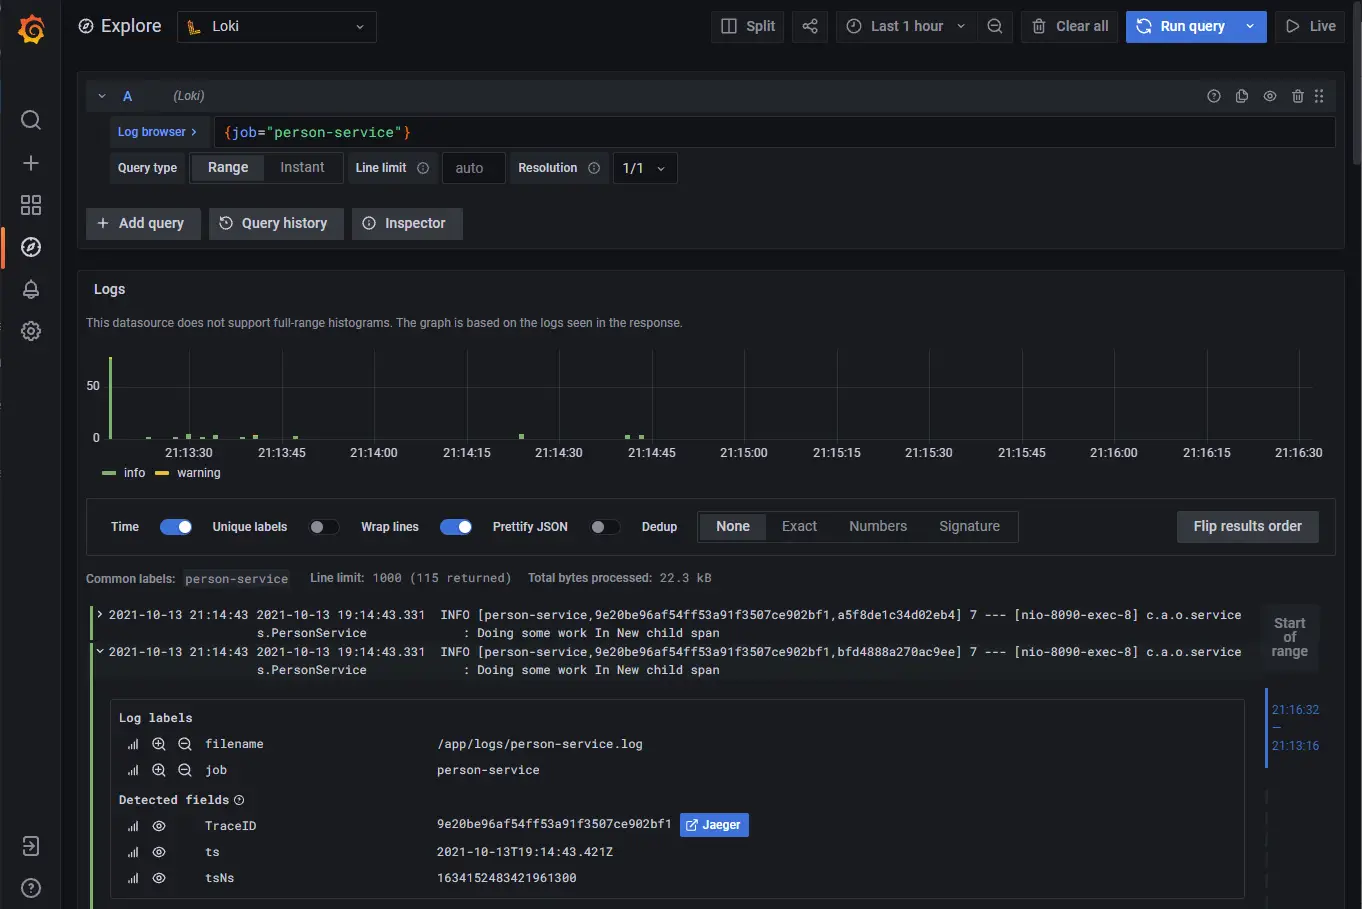
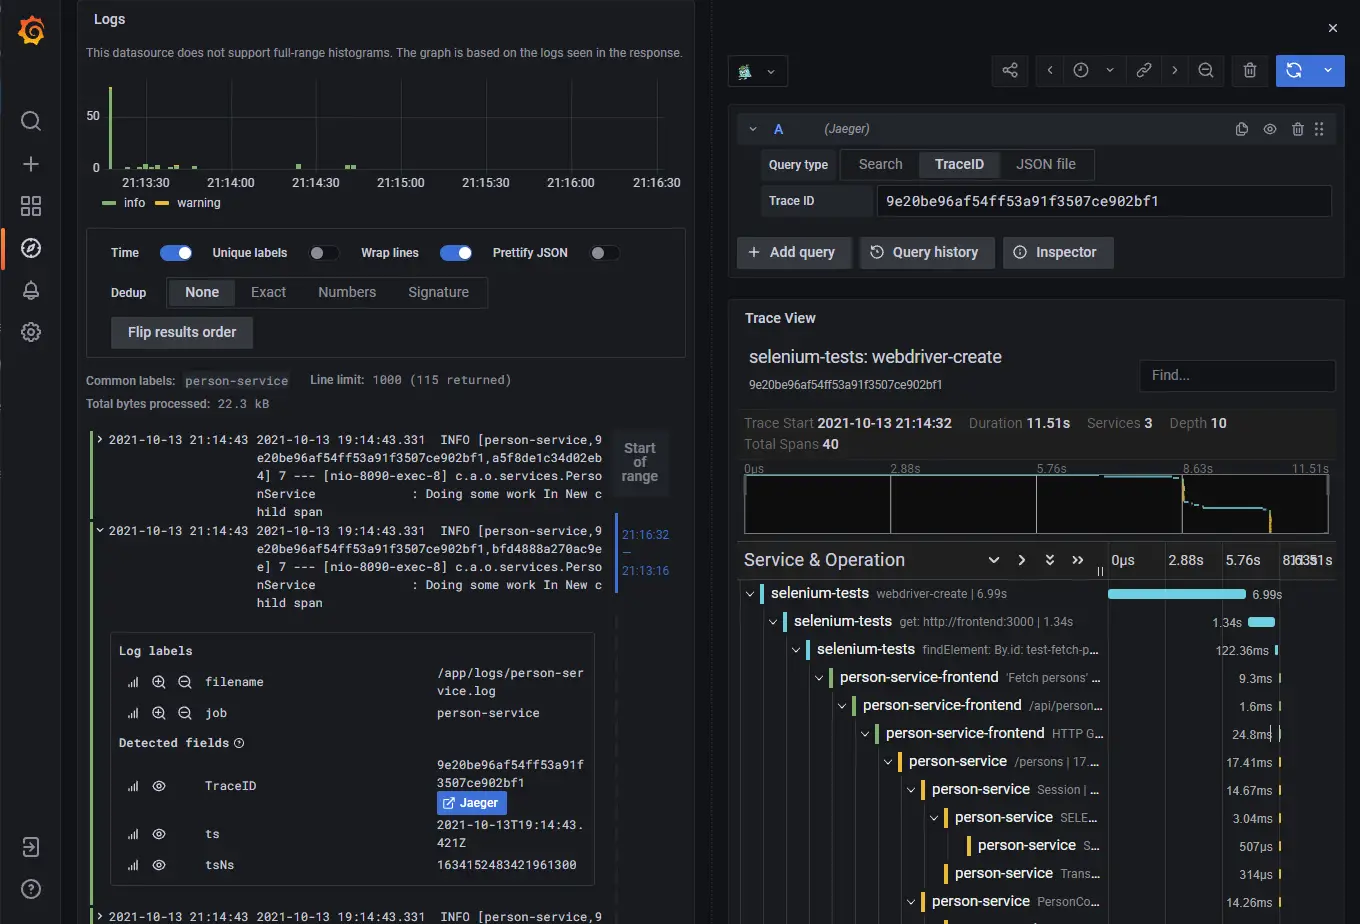
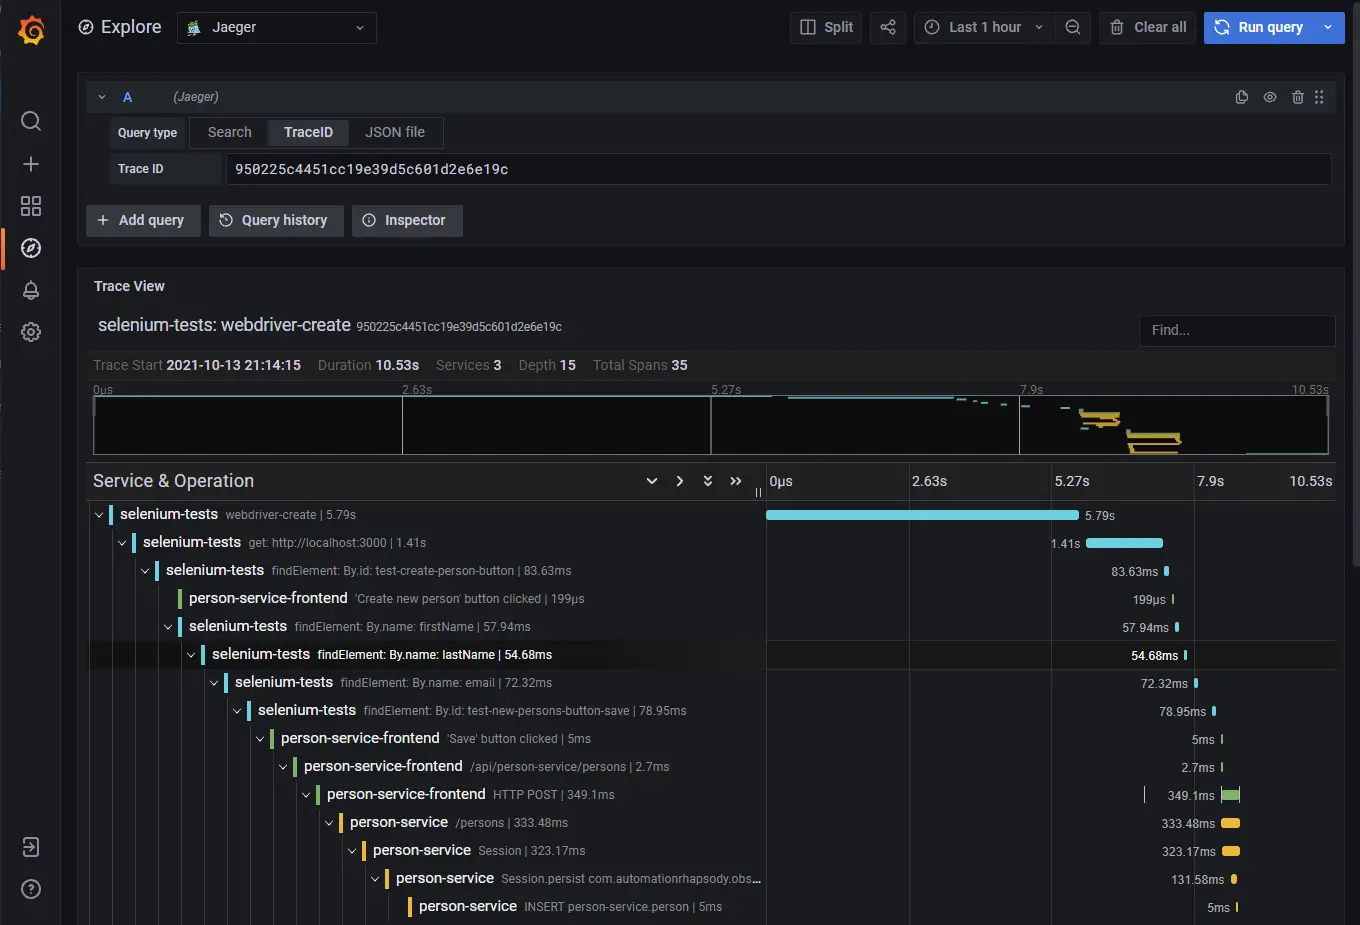
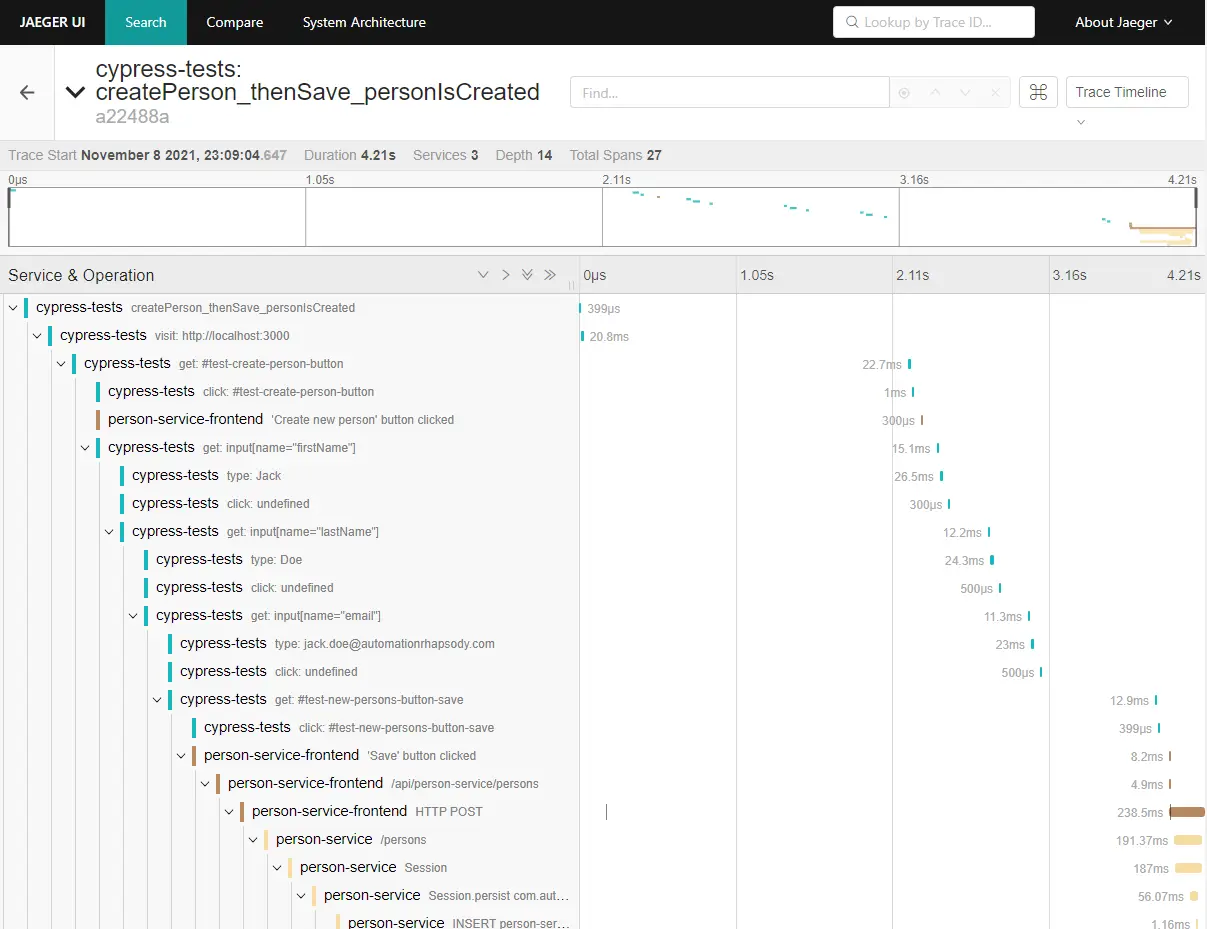
End-to-end traces in Jaeger
Conclusion
In the given examples, I have shown how to instrument Cypress tests in order to be able to track how they perform. I have provided two approaches, with overwriting the default Cypress command and with providing a tracing wrapper for Cypress.