Distributed system observability: Instrument Cypress tests with OpenTelemetry

Last Updated on by

Post summary: Instrument Cypress tests with OpenTelemetry and be able to custom trace the tests.

This post is part of Distributed system observability: complete end-to-end example series. The code used for this series of blog posts is located in selenium-observability-java GitHub repository.

Cypress

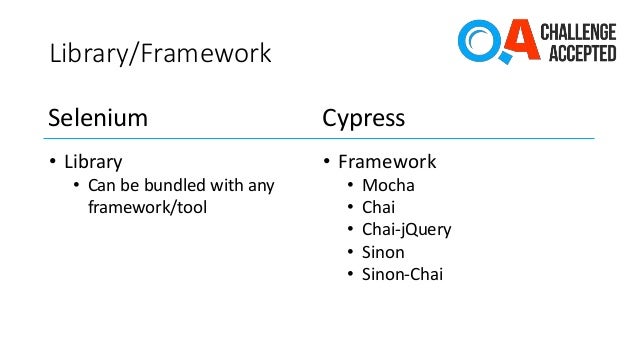
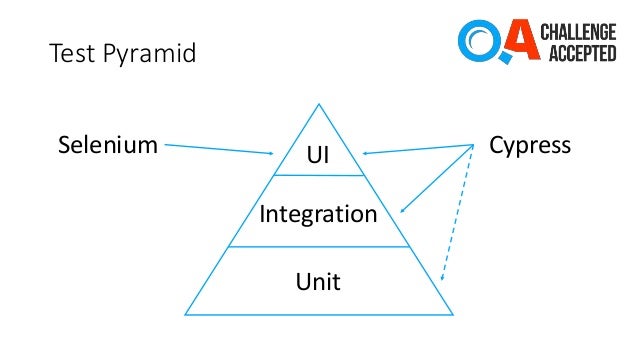
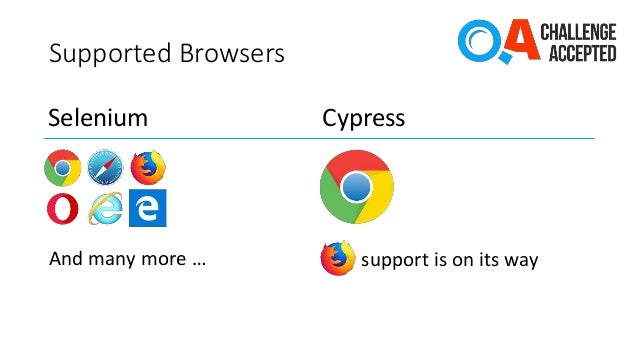
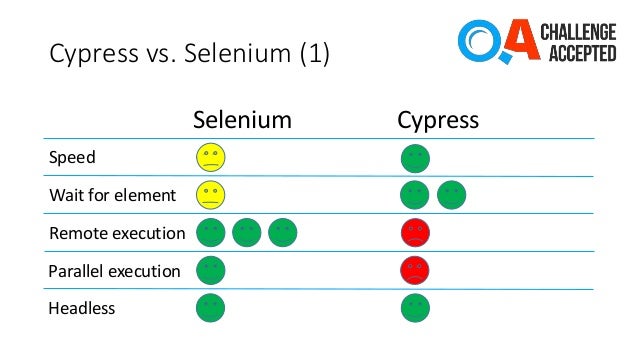
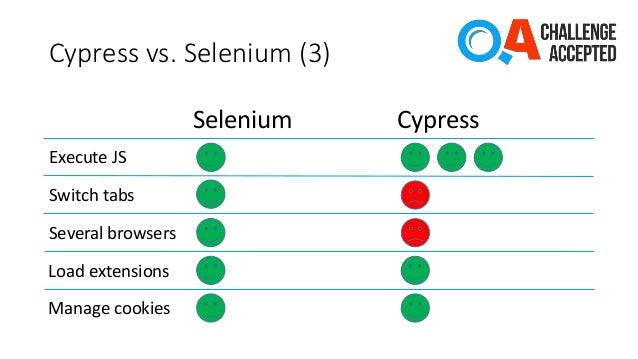
Cypress is a front-end testing tool built for the modern web. It is most often compared to Selenium; however, Cypress is both fundamentally and architecturally different. I have lots of experience with Cypress, I have written for it in Testing with Cypress – lessons learned in a complete framework post. Although it provides some benefits over Selenium, it also comes with its problems. Writing tests in Cypress is more complex than with Selenium. Cypress is more technically complex, which gives more power but is a real struggle for making decent test automation.

Cypress tests custom observability

As stated before, in the case of HTTP calls, the OpenTelemetry binding between both parties is the traceparent header. I want to bind the Selenium tests with the frontend, so it comes naturally to mind – open the URL in the browser and provide this HTTP header. After research, I could not find a way to achieve this. I implemented a custom solution, which is Cypress independent and can be customized as needed. Moreover, it is a web automation framework independent, this approach can be used with any web automation tool. See examples for the same approach in Selenium in Distributed system observability: Instrument Selenium tests with OpenTelemetry post.

Instrument the frontend

In order to achieve linking, a JavaScript function is exposed in the frontend, which creates a parent Span. Then this JS function is called from the tests when needed. This function is named startBindingSpan() and is registered with the window global object. It creates a binding span with the same attributes (traceId, spanId, traceFlags) as the span used in the Selenium tests. This span never ends, so is not recorded in the traces. In order to enable this span, the traceSpan() function has to be manually used in the frontend code, because it links the current frontend context with the binding span. I have added another function, called flushTraces(). It forces the OpenTelemetry library to report the traces to Jaeger. Reporting is done with an HTTP call and the browser should not exit before all reporting requests are sent.

Note: some people consider exposing such a window-bound function in the frontend to modify React state as an anti-pattern. Frontend code is in src/helpers/tracing/index.ts:

declare const window: any
var bindingSpan: Span | undefined

window.startBindingSpan = (traceId: string, spanId: string, traceFlags: number) => {
  bindingSpan = webTracerWithZone.startSpan('')
  bindingSpan.spanContext().traceId = traceId
  bindingSpan.spanContext().spanId = spanId
  bindingSpan.spanContext().traceFlags = traceFlags
}

window.flushTraces = () => {
  provider.activeSpanProcessor.forceFlush().then(() => console.log('flushed'))
}

export function traceSpan<F extends (...args: any)
    => ReturnType<F>>(name: string, func: F): ReturnType<F> {
  var singleSpan: Span
  if (bindingSpan) {
    const ctx = trace.setSpan(context.active(), bindingSpan)
    singleSpan = webTracerWithZone.startSpan(name, undefined, ctx)
    bindingSpan = undefined
  } else {
    singleSpan = webTracerWithZone.startSpan(name)
  }
  return context.with(trace.setSpan(context.active(), singleSpan), () => {
    try {
      const result = func()
      singleSpan.end()
      return result
    } catch (error) {
      singleSpan.setStatus({ code: SpanStatusCode.ERROR })
      singleSpan.end()
      throw error
    }
  })
}

Instrument Cypress tests

In order to achieve the tracing, OpenTelemetry JavaScript libraries are needed. Those libraries are the same used in the frontend and described in Distributed system observability: Instrument React application with OpenTelemetry post. Those libraries send the data in OpenTelemetry format, so OpenTelemetry Collector is needed to convert the traces into Jaeger format. OpenTelemetry collector is already started into the Docker compose landscape, so it just needs to be used, its endpoint is http://localhost:4318/v1/trace. There is a function that creates an OpenTelemetry tracer. I have created two implementations on the tracing. One is by extending the existing Cypress commands. Another is by creating a tracing wrapper around Cypress. Both of them use the tracer creating function. Both of them coexist in the same project, but cannot run simultaneously.

import { WebTracerProvider } from '@opentelemetry/sdk-trace-web'
import { Resource } from '@opentelemetry/resources'
import { SimpleSpanProcessor } from '@opentelemetry/sdk-trace-base'
import { CollectorTraceExporter } from '@opentelemetry/exporter-collector'
import { ZoneContextManager } from '@opentelemetry/context-zone'

export function initTracer(name) {
  const resource = new Resource({ 'service.name': name })
  const provider = new WebTracerProvider({ resource })

  const collector = new CollectorTraceExporter({
    url: 'http://localhost:4318/v1/trace'
  })
  provider.addSpanProcessor(new SimpleSpanProcessor(collector))
  provider.register({ contextManager: new ZoneContextManager() })

  return provider.getTracer(name)
}

Tracing Cypress tests – override default commands

Cypress allows you to overwrite existing commands. This feature will be used in order to do the tracing, commands will perform their normal functions, but also will trace. This is achieved in cypress-tests/cypress/support/commands_tracing.js file.

import { context, trace } from '@opentelemetry/api'
import { initTracer } from './init_tracing'

const webTracerWithZone = initTracer('cypress-tests-overwrite')

var mainSpan = undefined
var currentSpan = undefined
var mainWindow

function initTracing(name) {
  mainSpan = webTracerWithZone.startSpan(name)
  currentSpan = mainSpan
  trace.setSpan(context.active(), mainSpan)
  mainSpan.end()
}

function initWindow(window) {
  mainWindow = window
}

function createChildSpan(name) {
  const ctx = trace.setSpan(context.active(), currentSpan)
  const span = webTracerWithZone.startSpan(name, undefined, ctx)
  trace.setSpan(context.active(), span)
  return span
}

Cypress.Commands.add('initTracing', name => initTracing(name))

Cypress.Commands.add('initWindow', window => initWindow(window))

Cypress.Commands.overwrite('visit', (originalFn, url, options) => {
  currentSpan = mainSpan
  const span = createChildSpan(`visit: ${url}`)
  currentSpan = span
  const result = originalFn(url, options)
  span.end()
  return result
})

Cypress.Commands.overwrite('get', (originalFn, selector, options) => {
  const span = createChildSpan(`get: ${selector}`)
  currentSpan = span
  const result = originalFn(selector, options)
  span.end()
  mainWindow.startBindingSpan(span.spanContext().traceId,
    span.spanContext().spanId, span.spanContext().traceFlags)
  return result
})

Cypress.Commands.overwrite('click', (originalFn, subject, options) => {
  const span = createChildSpan(`click: ${subject.selector}`)
  const result = originalFn(subject, options)
  span.end()
  return result
})

Cypress.Commands.overwrite('type', (originalFn, subject, text, options) => {
  const span = createChildSpan(`type: ${text}`)
  const result = originalFn(subject, text, options)
  span.end()
  return result
})

This file with commands overwrite can be conditionally enabled and disabled with an environment variable. Variable is enableTracking and is defined in cypress.json file. This allows switching tracing on and off. In cypress.json file there is one more setting, chromeWebSecurity which overrides the CORS problem when tracing is sent to the OpenTelemetry collector. Cypress get command is the one that is used to do the linking between the tests and the frontend. It is calling the window.startBindingSpan function. In order for this to work, a window instance has to be set into the tests with the custom initWindow command.

Note: A special set of Page Objects is used with this implementation.

Tracing Cypress tests – implement a wrapper

Cypress allows you to overwrite existing commands. This feature will be used in order to do the tracing, commands will perform their normal functions, but also will trace. This is achieved in cypress-tests/cypress/support/tracing_cypress.js file.

import { context, trace } from '@opentelemetry/api'
import { initTracer } from './init_tracing'

export default class TracingCypress {
  constructor() {
    this.webTracerWithZone = initTracer('cypress-tests-wrapper')
    this.mainSpan = undefined
    this.currentSpan = undefined
  }

  _createChildSpan(name) {
    const ctx = trace.setSpan(context.active(), this.currentSpan)
    const span = this.webTracerWithZone.startSpan(name, undefined, ctx)
    trace.setSpan(context.active(), span)
    return span
  }

  initTracing(name) {
    this.mainSpan = this.webTracerWithZone.startSpan(name)
    this.currentSpan = this.mainSpan
    trace.setSpan(context.active(), this.mainSpan)
    this.mainSpan.end()
  }

  visit(url, options) {
    this.currentSpan = this.mainSpan
    const span = this._createChildSpan(`visit: ${url}`)
    this.currentSpan = span
    const result = cy.visit(url, options)
    span.end()
    return result
  }

  get(selector, options) {
    const span = this._createChildSpan(`get: ${selector}`)
    this.currentSpan = span
    const result = cy.get(selector, options)
    span.end()
    return result
  }

  click(subject, options) {
    const span = this._createChildSpan('click')
    subject.then(element =>
      element[0].ownerDocument.defaultView.startBindingSpan(
        span.spanContext().traceId,
        span.spanContext().spanId,
        span.spanContext().traceFlags
      )
    )
    const result = subject.click(options)
    span.end()
    return result
  }

  type(subject, text, options) {
    const span = this._createChildSpan(`type: ${text}`)
    const result = subject.type(text, options)
    span.end()
    return result
  }
}

In order to make this implementation work, it is mandatory to set enableTracking variable in cypress.json file to falseTracingCypress is instantiated in each and every test. An instance of it is provided as a constructor argument to the Page Object for this approach. The important part here is that the binding window.startBindingSpan is called in the get() method.

Note: A special set of Page Objects is used with this implementation.

End-to-end traces in Jaeger

Conclusion

In the given examples, I have shown how to instrument Cypress tests in order to be able to track how they perform. I have provided two approaches, with overwriting the default Cypress command and with providing a tracing wrapper for Cypress.

Related Posts

Read more...

Distributed system observability: Instrument Selenium tests with OpenTelemetry

Last Updated on by

Post summary: Instrument Selenium tests with OpenTelemetry and be able to custom trace the tests themselves.

This post is part of Distributed system observability: complete end-to-end example series. The code used for this series of blog posts is located in selenium-observability-java GitHub repository.

Selenium

Selenium is browser automation software. It’s been around for many years and is de-facto the tool for web automation testing. It has bindings in all popular programming languages, which means people can write web automation tests in those languages.

Selenium observability

Selenium 4 comes with a pack of features. One of those features is the Selenium observability feature. It uses OpenTracing to keep track of the request’s lifecycle. This feature was the main driving factor for me to start to research the current examples. I pictured in my head end-to-end observability, from the test action down to the database call. I have to come up with a custom tracing solution, that is described in this post.

Selenium WebDriver architecture

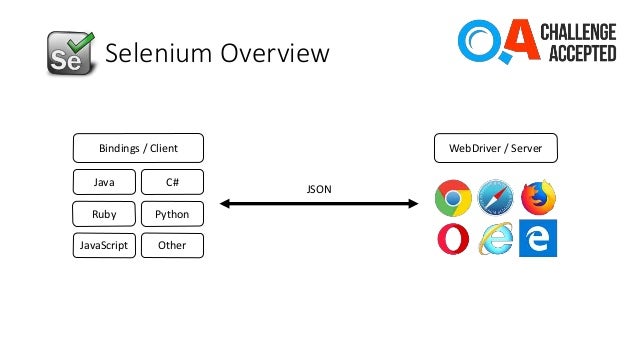
Selenium consist of a client, those are the bindings and server, these are the executables that control the given browser. Both communicate via HTTP calls with JSON payload. This is described in detail in the W3C Selenium specification. I attach a small diagram, I used in a presentation I did a long time ago.

Selenium client instrumentation

Enabling the default selenium observability is very easy. A Jar dependency has to be added in pom.xml, environment variables to be set, and of course running Jaeger instance to collect the traces. Note that this works only for the RemoteWebDriver. It is described in detail in Remote WebDriver.

<dependency>
    <groupId>io.opentelemetry</groupId>
    <artifactId>opentelemetry-exporter-jaeger</artifactId>
    <version>1.6.0</version>
</dependency>
<dependency>
    <groupId>io.grpc</groupId>
    <artifactId>grpc-netty</artifactId>
    <version>1.41.0</version>
</dependency>

This goes along with the WebDriver instantiation code.

System.setProperty("otel.traces.exporter", "jaeger");
System.setProperty("otel.exporter.jaeger.endpoint", "http://localhost:14250");
System.setProperty("otel.resource.attributes", "service.name=selenium-java-client");
System.setProperty("otel.metrics.exporter", "none");
WebDriver driver = new RemoteWebDriver(
                new URL("http://localhost:4444"),
                new ImmutableCapabilities("browserName", "chrome"));

Selenium server instrumentation

Server instrumentation examples are shown in manoj9788/tracing-selenium-grid. Both the standalone server and Selenium grid can be instrumented. In the current examples, I am working only with the standalone server. Unlike the examples, I used Docker to do the instrumentation. I take the default selenium/standalone-chrome:4.0.0 image and install Coursier, a dependency resolver tool, on top of it. Then I run the dependency fetch, so this build sted gets cached for a faster rebuild. Selenium provides –ext flag, which can be set after the standalone command option. I could not make this work only by changing the SE_OPTS environment variable, so I made this rewrite of the startup command in /opt/bin/start-selenium-standalone.sh file. What I did was to change from java -jar to java -cp command, as -cp flag is ignored in case -jar flag is used.

FROM selenium/standalone-chrome:4.0.0

# Install coursier in order to fetch the dependencies
RUN cd /tmp && curl -k -fLo cs https://git.io/coursier-cli-"$(uname | tr LD ld)" && chmod +x cs && ./cs install cs && rm cs

# Download dependencies, so they are availble during run
RUN /home/seluser/.local/share/coursier/bin/cs fetch -p io.opentelemetry:opentelemetry-exporter-jaeger:1.6.0 io.grpc:grpc-netty:1.41.0

# Modify the run command to include dependent JARs in it
RUN sudo sed -i 's~-jar /opt/selenium/selenium-server.jar~-cp "/opt/selenium/selenium-server.jar:$(/home/seluser/.local/share/coursier/bin/cs fetch -p io.opentelemetry:opentelemetry-exporter-jaeger:1.6.0 io.grpc:grpc-netty:1.41.0)" org.openqa.selenium.grid.Main~g' /opt/bin/start-selenium-standalone.sh

# Enable OpenTelemetry
ENV JAVA_OPTS "$JAVA_OPTS \
  -Dotel.traces.exporter=jaeger \
  -Dotel.exporter.jaeger.endpoint=http://jaeger:14250 \
  -Dotel.resource.attributes=service.name=selenium-java-server"

Selenium default traces in Jaeger

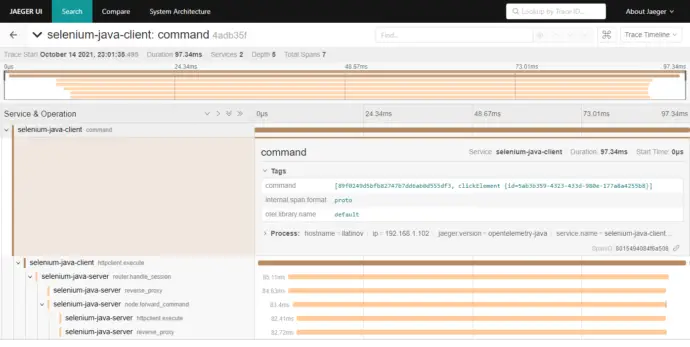
RemoteWebDriver client is passing down the traceparent header when making the request to the server, this is why both client and server traces are connected.

Selenium tests custom observability

As stated before, in the case of HTTP calls, the OpenTelemetry binding between both parties is the traceparent header. I want to bind the Selenium tests with the frontend, so it comes naturally to mind – open the URL in the browser and provide this HTTP header. After research, I could not find a way to achieve this. I implemented a custom solution, which is WebDriver independent and can be customized as needed. Moreover, it is a web automation framework independent, this approach can be used with any web automation tool. An example of how tracing can be done with Cypress is shown in Distributed system observability: Instrument Cypress tests with OpenTelemetry post.

Instrument the frontend

In order to achieve linking, a JavaScript function is exposed in the frontend, which creates a parent Span. Then this JS function is called from the tests when needed. This function is named startBindingSpan() and is registered with the window global object. It creates a binding span with the same attributes (traceId, spanId, traceFlags) as the span used in the Selenium tests. This span never ends, so is not recorded in the traces. In order to enable this span, the traceSpan() function has to be manually used in the frontend code, because it links the current frontend context with the binding span. I have added another function, called flushTraces(). It forces the OpenTelemetry library to report the traces to Jaeger. Reporting is done with an HTTP call and the browser should not exit before all reporting requests are sent.

Note: some people consider exposing such a window-bound function in the frontend to modify React state as an anti-pattern. Frontend code is in src/helpers/tracing/index.ts:

declare const window: any
var bindingSpan: Span | undefined

window.startBindingSpan = (traceId: string, spanId: string, traceFlags: number) => {
  bindingSpan = webTracerWithZone.startSpan('')
  bindingSpan.spanContext().traceId = traceId
  bindingSpan.spanContext().spanId = spanId
  bindingSpan.spanContext().traceFlags = traceFlags
}

window.flushTraces = () => {
  provider.activeSpanProcessor.forceFlush().then(() => console.log('flushed'))
}

export function traceSpan<F extends (...args: any)
    => ReturnType<F>>(name: string, func: F): ReturnType<F> {
  var singleSpan: Span
  if (bindingSpan) {
    const ctx = trace.setSpan(context.active(), bindingSpan)
    singleSpan = webTracerWithZone.startSpan(name, undefined, ctx)
    bindingSpan = undefined
  } else {
    singleSpan = webTracerWithZone.startSpan(name)
  }
  return context.with(trace.setSpan(context.active(), singleSpan), () => {
    try {
      const result = func()
      singleSpan.end()
      return result
    } catch (error) {
      singleSpan.setStatus({ code: SpanStatusCode.ERROR })
      singleSpan.end()
      throw error
    }
  })
}

Instrument the Selenium tests

I have created a custom TracingWebDriver wrapper over the WebDriver. It instantiates the OpenTracing client with initializeTracer() method. It has a built-in custom logic when to generate a tracking span, which is the parent of this span, and when to link the tests’ span with the frontend span. Finding an element is done with the custom findElement() method. It creates a child span, linking it to the previously defined currentSpan. Then the window.startBindingSpan() function is being called in the browser in order to create the binding span in the frontend. This is the way to link tests and the frontend. In case of error, Span is recorded as an error and this can be tracked in Jaeger. On driver quit, or on URL change, or maybe on page change via a button, or whenever needed, window.flushTraces() function can be called by invoking forceFlushTraces() method in the tests. This has 1 second of Thread.sleep(), which waits for the tracing request to be fired from the frontend to the Jaeger. Sleeping like this is an anti-pattern for test automation, but I could not find a better way to wait for the traces. If the browser is prematurely closed or the page is navigated, then tracing is incorrect.

package com.automationrhapsody.observability;

import io.opentelemetry.api.trace.Span;
import io.opentelemetry.api.trace.StatusCode;
import io.opentelemetry.api.trace.Tracer;
import io.opentelemetry.context.Context;
import io.opentelemetry.exporter.jaeger.JaegerGrpcSpanExporter;
import io.opentelemetry.sdk.OpenTelemetrySdk;
import io.opentelemetry.sdk.resources.Resource;
import io.opentelemetry.sdk.trace.SdkTracerProvider;
import io.opentelemetry.sdk.trace.export.SimpleSpanProcessor;
import org.openqa.selenium.*;
import org.openqa.selenium.remote.tracing.opentelemetry.OpenTelemetryTracer;
import org.openqa.selenium.support.ui.ExpectedConditions;
import org.openqa.selenium.support.ui.WebDriverWait;

import java.io.File;
import java.time.Duration;
import java.util.List;

public class TracingWebDriver {

    private static final Duration WAIT_SECONDS = Duration.ofSeconds(5);
    private static final String JAEGER_GRPC_URL = "http://localhost:14250";

    private WebDriver driver;
    private Tracer tracer;
    private Span mainSpan;
    private Span currentSpan;

    public TracingWebDriver(boolean isRemote, String className, String methodName) {
        System.setProperty("otel.traces.exporter", "jaeger");
        System.setProperty("otel.exporter.jaeger.endpoint", JAEGER_GRPC_URL);
        System.setProperty("otel.resource.attributes", "service.name=selenium-java-client");
        System.setProperty("otel.metrics.exporter", "none");

        initializeTracer();

        mainSpan = tracer.spanBuilder("webdriver-create").startSpan();
        mainSpan.setAttribute("test.class.name", className);
        mainSpan.setAttribute("test.method.name", methodName);
        setCurrentSpan(mainSpan);
        driver = WebDriverFactory.createDriver(isRemote);
        mainSpan.end();
    }

    public void get(String url) {
        waitToLoad();
        setCurrentSpan(mainSpan);
        Span span = createChildSpan("get: " + url);
        try {
            forceFlushTraces();
            driver.get(url);
            createBrowserBindingSpan(span);
        } catch (Exception ex) {
            span.setStatus(StatusCode.ERROR, ex.getMessage());
            captureScreenshot();
        } finally {
            span.end();
        }
    }

    public WebElement findElement(By by) {
        waitToLoad();
        Span span = createChildSpan("findElement: " + by.toString());
        try {
            createBrowserBindingSpan(span);
            WebDriverWait wait = new WebDriverWait(driver, WAIT_SECONDS);
            return wait.until(ExpectedConditions.visibilityOfElementLocated(by));
        } catch (Exception ex) {
            span.setStatus(StatusCode.ERROR, ex.getMessage());
            captureScreenshot();
            return null;
        } finally {
            span.end();
        }
    }

    public void quit() {
        waitToLoad();
        forceFlushTraces();
        setCurrentSpan(mainSpan);
        Span span = createChildSpan("quit");
        driver.quit();
        span.end();
    }

    public Object executeJavaScript(String script) {
        return ((JavascriptExecutor) driver).executeScript(script);
    }

    public String captureScreenshot() {
        File screenshotFile = ((TakesScreenshot) driver).getScreenshotAs(OutputType.FILE);
        String output = screenshotFile.getAbsolutePath();
        System.out.println(output);
        return output;
    }

    private void waitToLoad() {
        WebDriverWait wait = new WebDriverWait(driver, WAIT_SECONDS);
        wait.until(ExpectedConditions.invisibilityOfElementLocated(By.id("test-progress-indicator")));
    }

    private void initializeTracer() {
        JaegerGrpcSpanExporter exporter = JaegerGrpcSpanExporter.builder().setEndpoint(JAEGER_GRPC_URL).build();
        Resource resource = Resource.builder()
                .put("service.name", "selenium-tests")
                .build();
        SdkTracerProvider provider = SdkTracerProvider.builder()
                .addSpanProcessor(SimpleSpanProcessor.create(exporter))
                .setResource(resource)
                .build();
        OpenTelemetrySdk openTelemetrySdk = OpenTelemetrySdk.builder()
                .setTracerProvider(provider)
                .build();
        tracer = openTelemetrySdk.getTracer("io.opentelemetry.jaeger.exporter");
    }

    private Span createChildSpan(String name) {
        Span span = tracer.spanBuilder(name)
                .setParent(Context.current().with(currentSpan))
                .startSpan();
        setCurrentSpan(span);
        return span;
    }

    private void setCurrentSpan(Span span) {
        currentSpan = span;
        OpenTelemetryTracer.getInstance().setOpenTelemetryContext(Context.current().with(span));
    }

    private void createBrowserBindingSpan(Span span) {
        executeJavaScript("window.startBindingSpan('"
                + span.getSpanContext().getTraceId() + "', '"
                + span.getSpanContext().getSpanId() + "', '"
                + span.getSpanContext().getTraceFlags().asHex() + "')");
    }

    private void forceFlushTraces() {
        executeJavaScript("if (window.flushTraces) window.flushTraces()");
        try {
            Thread.sleep(1000);
        } catch (InterruptedException e) {
            // Do nothing
        }
    }
}

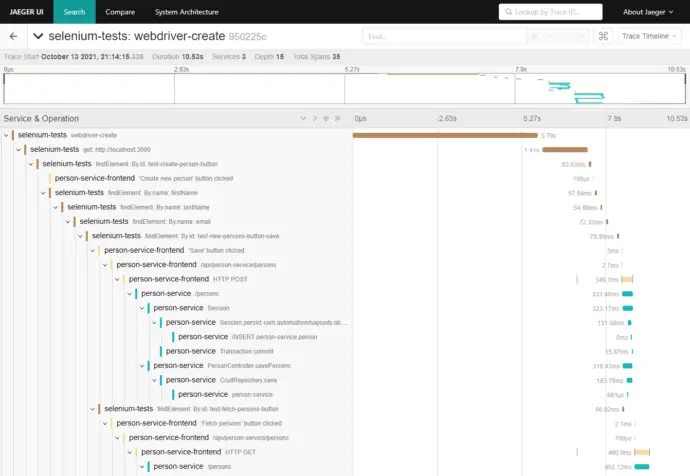
End-to-end traces in Jaeger

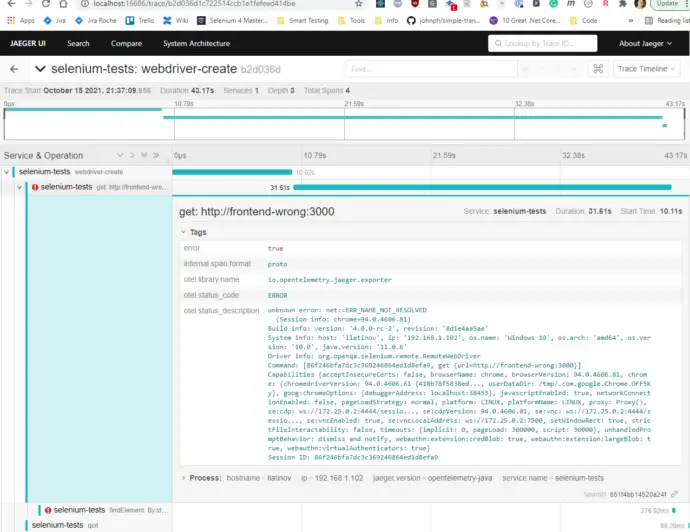
In case of error, this is also recorded.

Linking default and custom traces

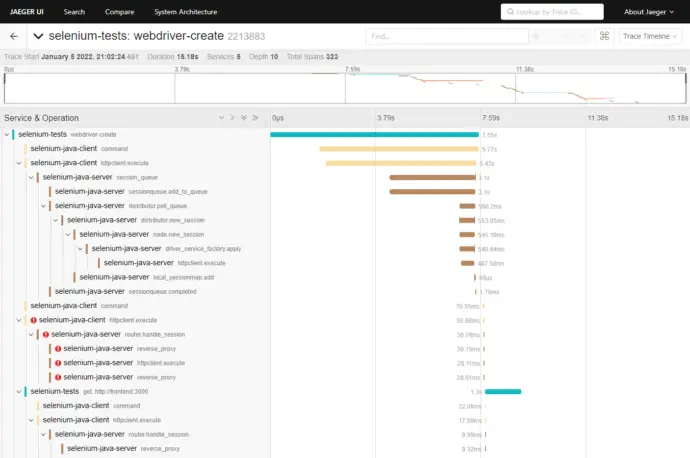
In an ideal world, I would like to make my custom Span parent of the default Selenium tracing spans, so I can attach the debug information to the custom tracing information. I was not able to do this. I have raised an issue with Selenium, OpenTelementry tracing: be able to link the default tracing with a custom tracing. I contributed to Selenium by adding this possibility to link Selenium traces to the custom traces. This is done with the following code OpenTelemetryTracer.getInstance().setOpenTelemetryContext(Context.current().with(span)). Finally, the full tracing looks as shown on the image:

Conclusion

The out-of-the-box Selenium observability is useful to trace what is happening in a complex grid. It does not give the possibility to trace tests performance and how test steps are affecting the application itself. In the current post, I have described a way to create a custom tracing, which provides end-to-end traceability from the tests down to the database calls. This approach gives the flexibility to be customized for different needs. It involves changes in the application’s frontend code though, which involves the application architecture topic in the discussions.

Related Posts

Read more...

Distributed system observability: complete end-to-end example with OpenTracing, Jaeger, Prometheus, Grafana, Spring Boot, React and Selenium

Last Updated on by

Post summary: Code examples and explanations on an end-to-end example showcasing a distributed system observability from the Selenium tests through React front end, all the way to the database calls of a Spring Boot application. Examples are implemented with the OpenTracing toolset and traces are saved in Jaeger. This example also shows a complete observability setup including tools like Grafana, Prometheus, Loki, and Promtail.

This post is part of Distributed system observability: complete end-to-end example series. The code used for this series of blog posts is located in selenium-observability-java GitHub repository.

Introduction

Nowadays, the MIcroservices architecture is very popular. It certainly has its benefits, allowing the companies to deliver faster products to the market. It is much easier to manage several small applications, each one of them with isolated responsibilities, rather than one big fat monolithic application. Microservices architecture has its challenges as well. One of those challenges is traceability. What happens in case of error, where did it occur, what microservices were involved, what were the requests flow through the system, where is the stack trace? In a monolithic application, the stack trace is shown into the logs, giving the exact location of the error. In a microservices landscape, errors are in many cases meaningless, unless there is full traceability of the request flow.

Observability and distributed tracing

Distributed tracing, also called distributed request tracing, is a method used to profile and monitor applications, especially those built using a microservices architecture. Distributed tracing helps pinpoint where failures occur and what causes poor performance. Logs, metrics, and traces are often known as the three pillars of observability. Further reading on observability can be done in The Three Pillars of Observability article.

OpenTracing

OpenTracing is an API specification and libraries, that enables the instrumentation of distributed applications. It is not locked to any particular vendors and allows flexibility just by changing the configuration of already instrumented applications. More details can be found in Instrumenting your application and What is Distributed Tracing?. Current examples are based on OpenTracing libraries and tools.

End-to-end traceability and observability

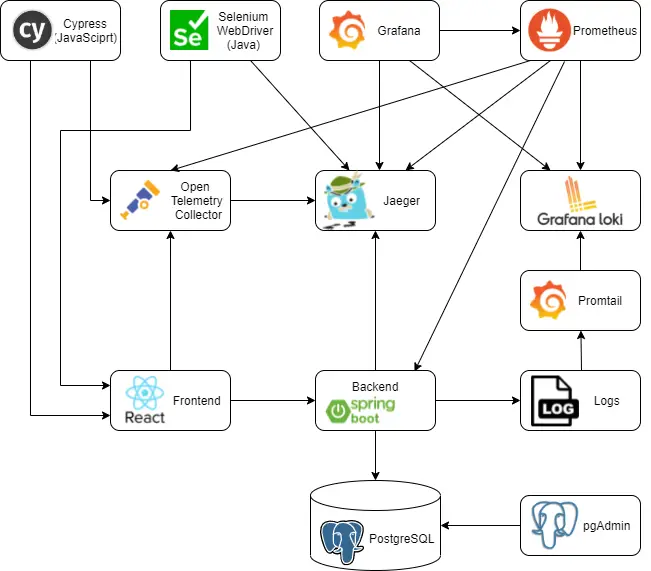
In the current examples, I am going to give an end-to-end solution, how observability can be achieved in a distributed system. I have used mnadeem/boot-opentelemetry-tempo project as a basis and have extended it with React Frontend and Selenium tests, to provide a complete end-to-end example. Below is a diagram of the full setup. All applications involved will be explained on a higher level.

PostgreSQL and pgAdmin

The basic examples used PostgreSQL, I thought of changing it to MySQL, but when I did short research, I found that PostgreSQL has some advantages. PostgreSQL is an object-relational database, while MySQL is a purely relational database. This means that Postgres includes features like table inheritance and function overloading, which can be important to certain applications. Postgres also adheres more closely to SQL standards. See more in MySQL vs PostgreSQL — Choose the Right Database for Your Project.

pgAdmin is the default user interface to manage a PostgreSQL database, so it is present in the architecture as well.

Spring Boot backend

Spring Boot is used as a backend. I did want to get some exposure to the technology, so I created a very basic application in Spring Boot. It uses the PostgreSQL database for reading and writing data. Spring Boot application is instrumented with OpenTelemetry Java library and exports the traces in Jaeger format directly to the Jaeger backend. It also writes application log files on a file system. Backend exposes APIs, which are consumed by the frontend. More details on the backend can be found in Distributed system observability: Instrument Spring Boot application with OpenTelemetry post.

React frontend

I am very experienced with React, so this was the natural choice for the frontend technology. The frontend uses fetch() to consume the backend APIs. It is instrumented with OpenTelementry JavaScript libraries to trace all communication happening through fetch() and to exports the traces in OpenTelemetry format to the OpenTelemetry collector. The frontend also has manual instrumentation which traces the actions done by end-users on it. More details on the frontend can be found in Distributed system observability: Instrument React application with OpenTelemetry post.

OpenTelemetry collector

OpenTelemetry collector converts the data received from the frontend in OpenTelemetry format into Jaeger format and exports it to the Jaeger backend. The collector is also extracting the span metrics, which are read by Prometheus, read more in Distributed system observability: extract and visualize metrics from OpenTelemetry spans post. Configurations are described in the collector configuration. Local configurations are in otel-config.yaml.

Selenium tests

Selenium was chosen for the web testing framework because of its observability feature. Actually, this was the reason for which I created the current examples. After getting to know the tracing features of Selenium better, I find them not much useful. Selenium does not provide traceability of the tests, but rather on its internal operations and performance. Having started with the tracing and the whole project, I could not ditch it in the middle, so I have to create a custom way to make Selenium trace the tests. Selenium tests export tracing information in Jaeger format directly into the Jaeger backend. More details on the tests can be found in Distributed system observability: Instrument Selenium tests with OpenTelemetry post.

Cypress tests

Cypress is a front-end testing tool built for the modern web. It is most often compared to Selenium. The initial driver of the current post series was Selenium observability. After I got a better understanding of the observability topic, I’ve decided to add examples on Cypress tests observability for more completeness of the examples. Cypress interacts with the Frontend and exports its traces to OpenTelemetry Collector, which then forwards the traces into Jaeger. More details on the tests can be found in Distributed system observability: Instrument Cypress tests with OpenTelemetry post.

Jaeger

Jaeger, inspired by Dapper and OpenZipkin, is an open-source distributed tracing system. It is used for monitoring and troubleshooting microservices-based distributed systems. Jaeger collects all the traces and provides a search and visualization of the traces. In the original examples, Grafana Tempo was used as a backend and Jaeger UI via the jaeger-query module to open the traces. I initially started with it, but Tempo does not provide a possibility to search the traces. I find this rather inconvenient, so I switched completely to Jaeger.

Promtail

Promtail is an agent which ships the contents of the Spring Boot backend logs to a Loki instance. It is usually deployed to every machine that has applications needed to be monitored. Local configurations are in promtail-local.yaml.

Loki

Grafana Loki is a log aggregation system inspired by Prometheus. It does not index the contents of the logs, but rather a set of labels for each log stream. Log data itself is then compressed and stored in chunks. In the current example, logs are being pushed to Loki by Promtrail. Local configurations are in loki-local.yaml.

Prometheus

Prometheus is an open-source monitoring and alerting toolkit. Prometheus collects and stores its metrics as time-series data, i.e. metrics information is stored with the timestamp at which it was recorded, alongside optional key-value pairs called labels. In the current example, Prometheus is monitoring the Sprint Boot backend, Loki, Jaeger, and OpenTelemetry Collector. It pulls the metrics data from those applications at a regular interval and stores them in its database. Alerts can be configured based on the metrics. Local configurations are in prometheus.yaml.

Grafana

Grafana is an open-source solution for running data analytics, pulling up metrics from different data sources, and monitoring applications with the help of customizable dashboards. The tool helps to study, analyze and monitor data over a period of time, technically called time-series analytics. In the current example, Grafana pulls data from Prometheus, Jaeger, and Loki. Local configurations are in grafana-dashboards.yaml and grafana-datasource.yml.

Explore the example

Running the example is very easy. What is needed is Docker compose and IDE that can run JUnit tests, I prefer IntelliJ IDEA. Run the examples:

  1. Check out the source code from https://github.com/llatinov/selenium-observability-java
  2. Run: docker-compose build
  3. Run: docker-compose up
  4. Open selenium-tests Maven project and run all the unit tests

Explore the example artifacts:

pgAdmin

pgAdmin is accessible at http://localhost:8005/. In order to log in, use the following credentials: pgadmin4@pgadmin.org / admin. This is needed only if the database records have to be read or modified.

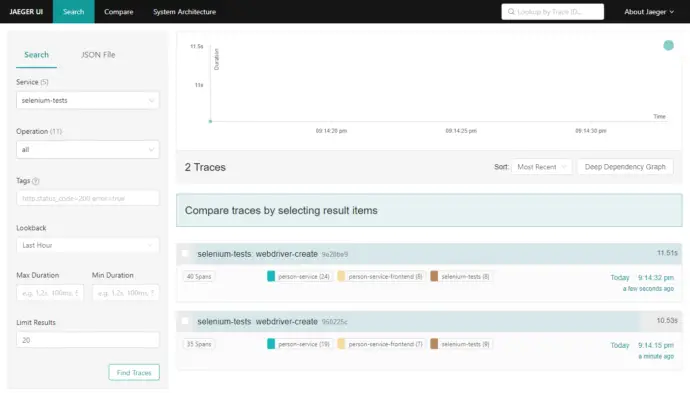
Jaeger

Jaeger is accessible at http://localhost:16686. The home page shows rich search functionality. There is a dropdown with all available services, then operations performed by the selected service can be also filtered.

A trace can be opened from the search results. It shows all the actions for this trace that have been recorded.

Grafana

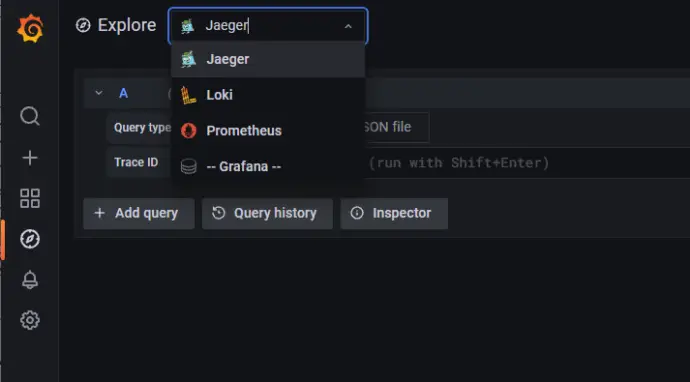
Grafana is accessible at http://localhost:3001. Different data sources can be accessed from the left-hand side menu, there is a small compass, the Explore menu. From the top, there is a dropdown with the available data sources.

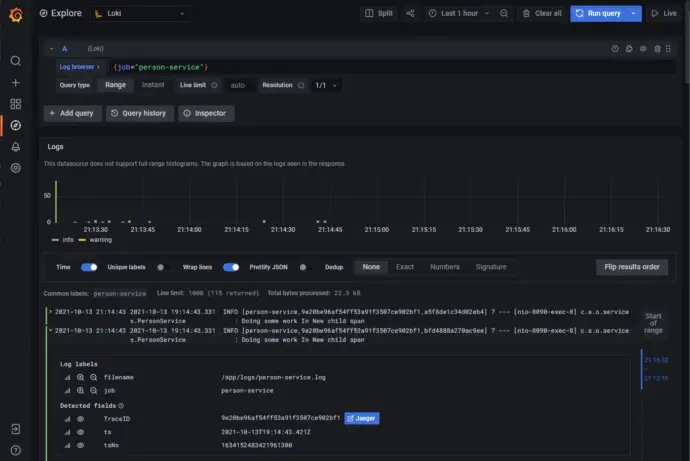
Grafana -> Loki

From Grafana select Loki as datasource. Search for {job=”person-service”}, this shows all logs for the Spring Boot backend.

Grafana -> Jaeger

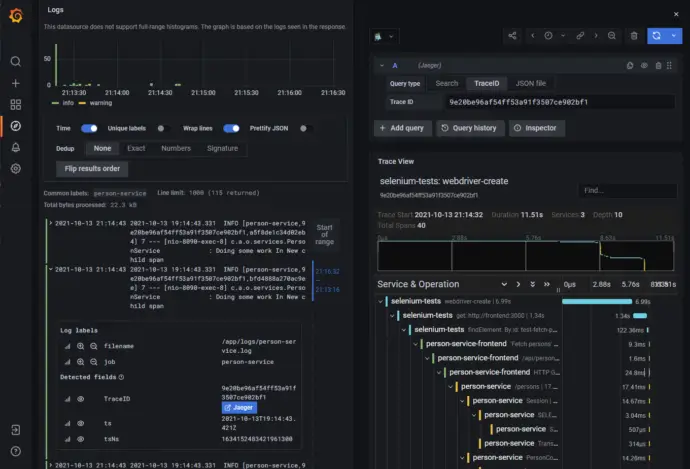
Jaeger data source can open a trace by its id. This data source can be used in conjunction with Loki. Search logs in Loki, then open a log, this exposes a Jaeger button.

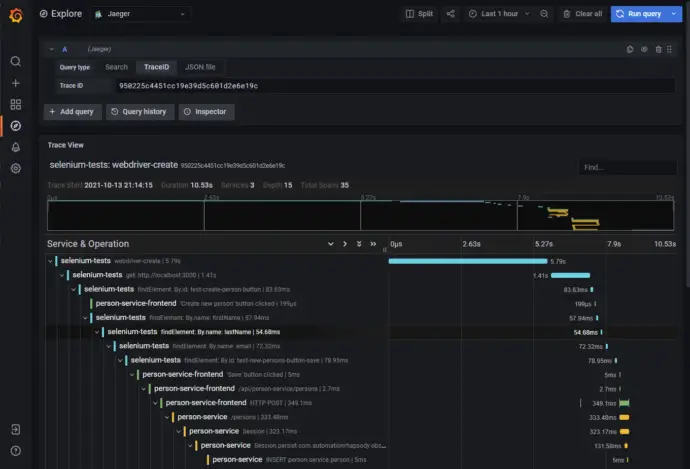
Jaeger data source can be opened directly from the dropdown, then type the TraceID.

Grafana -> Prometheus

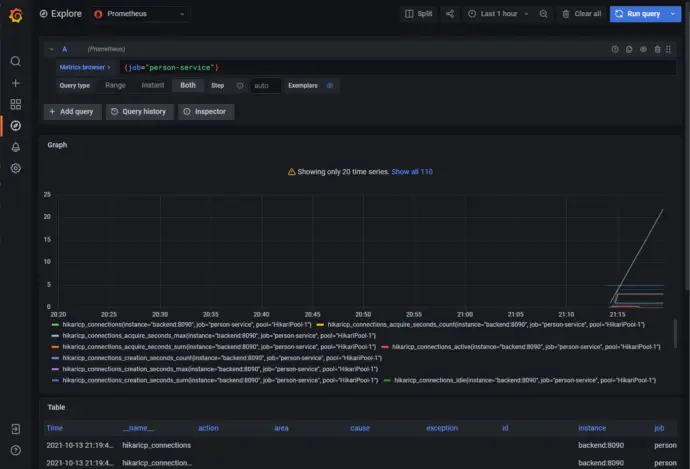
From Grafana select Prometheus as a data source. Search for {job=”person-service”}, this shows all metrics for the Spring Boot backend.

Prometheus

Prometheus is accessible at http://localhost:9090/. Search for {job=”person-service”}, this shows all metrics for the Spring Boot backend.

Furter posts with details

This is an introductory post, more details, explanations, and code examples on actual implementation can be found in the following posts:

Conclusion

Microservices architecture is used more often. Alongside its advantages, it comes with specific challenges. Observability is one of those challenges and is a very important topic in a distributed software system. In the current example, I have shown end-to-end observability achieved with popular open-source tools. The main objective of my experiments was to be able to trace Selenium test execution through all the systems involved in the distributed architecture.

Related Posts

Read more...

How to gather code coverage with Istanbul and Selenium and pitfalls to avoid

Last Updated on by

Post summary: Istanbul does not seem to be recoding code coverage correctly, it turned out that the tests do navigation by changing the URL, which resets the code coverage.

How to use Istanbul for code coverage of Cypress automated tests was explained in detail in Testing with Cypress – Custom logging of errors and JUnit results post.

Code coverage with Istanbul and Selenium

Recently I had to do it again, this time with Selenium. There are several approaches, which can be taken to measure code coverage with Selenium. Whichever approach is taken, the first step is to instrument the frontend. How to do it with React and create-react-app is described in Testing with Cypress – Code coverage with Istanbul post. Coverage is present in __coverage__ JS frontend variable.

Once the frontend is instrumented, it is important to collect the code coverage after the tests are run. This is where approaches differ. One option is to use istanbul-middleware. In this case, a Node.js backend has to be created and the tests should post the coverage results, taken from __coverage__ to the backend. I find this approach not convenient, so I took the easier one.

Once the test is finished, the code coverage data is collected and saved as a JSON file in a test results folder, then all the results are used to generate the report. I use C# and the code to do so is as simple as:

public void CollectCodeCoverage()
	{
		var data = ((IJavaScriptExecutor)_webDriver)
			.ExecuteScript("return window.__coverage__");
		if (data != null)
		{
			var jsonString = JsonConvert.SerializeObject(data);
			var fileName = $"{_testResultsFolder}/coverage_{DateTime.Now.Ticks}.json";
			File.WriteAllText(fileName, jsonString);
		}
	}

Generating code coverage report

The report is generated with the nyc cli tool. Once all the JSON files are copied into a folder with the name .nyc_output, the command to run the report is nyc report –reporter=html. Nyc can be installed as a global NPM package or can be added to the frontend project inside package.json.

The issues measuring the code coverage

The setup described above is clear and easy to achieve. Although when tests were run, they did not record coverage, which was supposed to be there. I have spent several days trying to figure out what the issue was. And finally, I was able to understand. In my tests, I use _webDriver.Navigate().GoToUrl(). This actually visits a new URL, basically invalidating all the coverage results gathered so far. Once the problem was identified, the solution was pretty simple – save the cove coverage every time before a new URL is about to get opened.

Conclusion

Istanbul is a very good tool to measure the code coverage for web automation tests. In the current post, I have described a pitfall, which should be avoided when using it.

Related Posts

Read more...

Testing with Cypress – Custom logging of errors and JUnit results

Last Updated on by

Post summary: Description of the custom error logger and also custom JUnit XML file creator.

This post is part of a Cypress series, you can see all post from the series in Testing with Cypress – lessons learned in a complete framework. Examples code is located in cypress-testing-framework GitHub repository.

The issue

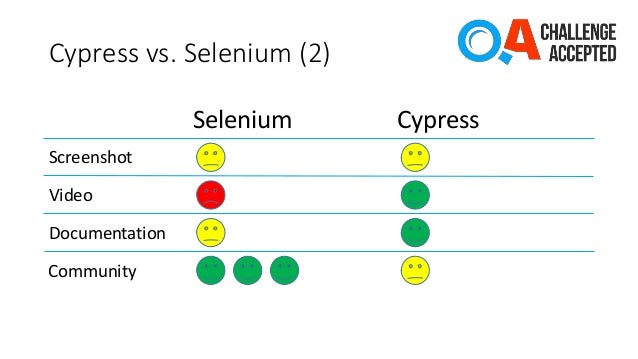
Cypress is not good at error tracking and reporting. If a test fails it is hard to understand why. Errors sometimes are vague, stacktrace is not useful as it does not lead to the proper line of your code since it is being wrapped into Cypress’ code. Forget about the nice stack traces that Java/C# code is producing, where you just go, find, and eliminate the error without even debugging. Debugging errors in tests is much harder with Cypress.
The solution

Gleb Bahmutov, currently a VP of Engineering at Cypress.io has a nice NPM package, called cypress-failed-log. It gathers commands that Cypress was executing during a test run and in case of a failure saves them to a file. You can inspect the file and trace what parts of your test were executed.

Modified solution

I started with that solution but did not enjoy it much. What I did is to take the base code and modify it. Those modifications are still tracking the Cypress commands, but also they track requests and response being exchanged by application and the backend, so in case of error you can also inspect the backend response. One important thing is that each test should have a unique name, otherwise overlapping may occur. The logging code is located in cypress/support/core/cypress_logging.js file, it is registered to Cypress within cypress/support/index.js file with import ‘./core/cypress_logging’;. The code also copies the screenshot of the test failure for better understanding of the error.

Capturing of request/response between the backend and the frontend can be controlled with TEST_CAPTURE_RESPONSES environment variable, it is true by default. Sometimes you will need to avoid certain requests/responses from being captured as they are not important. This can be done with TEST_CAPTURE_RESPONSES_EXCLUDE_PATHS variable, use asterisks to match the URLs. For e.g. I am testing a Ruby on Rails application which has a profiler enabled, which massively pollutes the logs, so I exclude those with ‘*/mini-profiler-resources/*’ pattern.

All this data is saved as a file with the name of the test inside a folder with the name of the suite. For e.g. cypress/logs/logging/multiple_testsuites_mix_spec.js/Test suite mix #1 — test case #2 (failed).json. The name of the JSON file is same as the name of the automatically generated screenshot on failure.

JUnit results with Cypress

In order to make Cypress output the test results into JUnit XML file following steps has to be done. Add the following configuration into cypress.json. This configuration makes Cypress create JUnit XML file. The important bit here is [hash] in the file name, otherwise, Cypress will overwrite the files.

{
    "reporter": "junit",
    "reporterOptions": {
        "mochaFile": "results/my-test-output-[hash].xml"
    }
}

If you use some CI tool then you can pass the XML results to it and it will visualize them.

Additionally, you can manipulate the XML results, you can merge them into just one XML file by installing junit-merge as a global NPM package and run junit-merge -d results -o results/merged.xml.

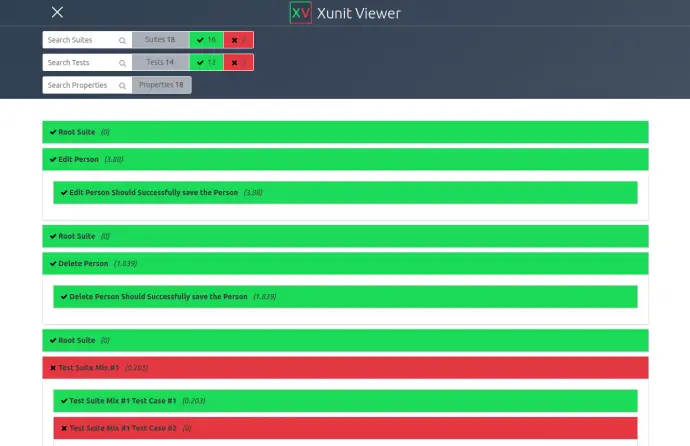
You can generate an HTML from XMLs with xunit-viewer NPM package. In case you have merged the XMLs into one then the command is xunit-viewer –results=results/merged.xml –output=results/merged.html, in case you have not the command is xunit-viewer –results=results –output=results/merged.html.

Custom JUnit results

Well, the out of the box solution is good but not enough for me. It does not show the skipped tests, it adds one more testsuite with name Root Suite, which is empty and Jenkins for e.g. avoids it, but if you want to visualize the results into HTML then it is a problem. What I have done is to generate JUnit XML on my own. This happens automatically in cypress_logging.js file. Files are put into the cypress/logs folder and have the name of the suite. Processing of the custom results is additionally made in provided code, you can read mode in Testing with Cypress – Code with Istanbul post.

Compare of JUnit reports

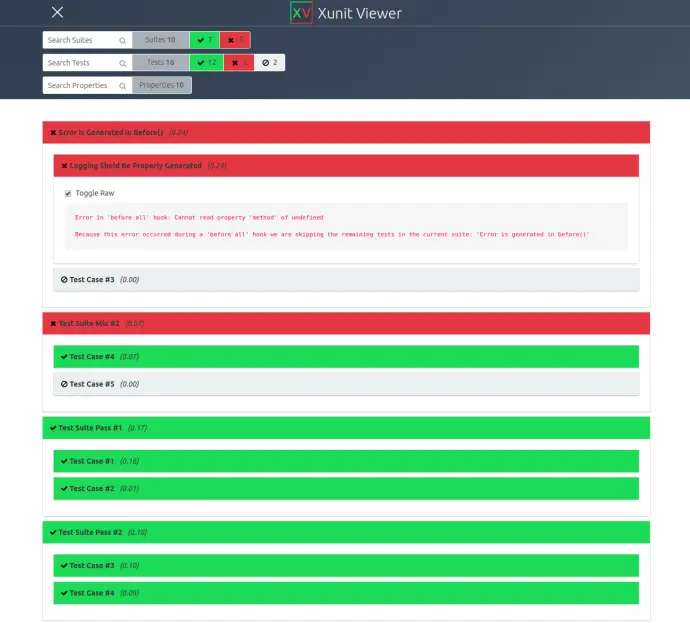
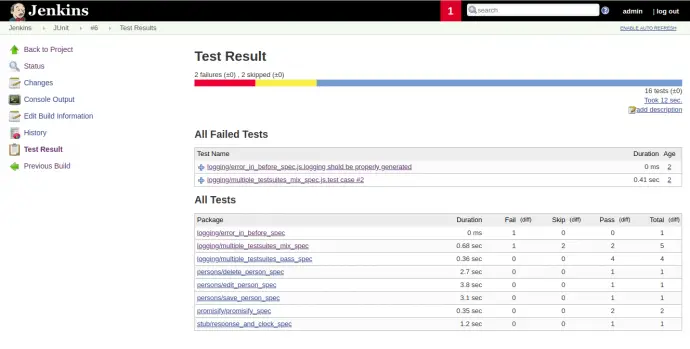
In this section, I will put some comparison of Cypress JUnit results and the one I have created. See the images below how HTML report looks like. HTML files can be opened from Cypress-report.html and Custom-report.html. XML results can be downloaded from xmls.zip.

Cypress standard HTML report

Cypress custom HTML report

I also made a quick Jenkins installation from its Docker container and uploaded the results for comparison. Below are the images of the comparison. Both JUnit reports are not visualized very well. Mostly this is because of the fact that JUnit is a format for Java tests, where we have packages and Jenkins is visualizing the results based on this assumption.

Cypress Jenkins standard

Cypress Jenkins custom

HTML Reports

HTML report is generated with xunit-viewer NPM package as described above. It is done by invoking the yarn cypress:report command. Above you can also see how HTML report looks like.

Semaphore file

Apart from the HTML report, there is one more file that is generated. It is named failed.txt. We are using AWS CodeBuild for CI/CD and we just need an indicator if the build passed or not. If this file is present then the build failed. The file content shows which are the failed suites. The whole artifacts are zipped and uploaded to an S3 bucket where can be investigated later.

Conclusion

In the current post, I have described the custom functionality I have for improving the debugging of failed tests by logging more information. Also, I have made a custom JUnit reporting of the test results. An HTML report is generated for better visualization of the results.

Related Posts

Read more...

Testing with Cypress – Basic API overview

Last Updated on by

Post summary: Basic overview of the Cypress API with code samples for some of the interesting features.

This post is part of a Cypress series, you can see all post from the series in Testing with Cypress – lessons learned in a complete framework. Examples code is located in cypress-testing-framework GitHub repository.

Cypress API

Cypress is so much different than Selenium, so it takes some time to get used to the way elements are located and interacted with. I am not going into details about the API here but will mention some basic things. Methods in the API are kind of self-explanatory, mainly used ones are: get, find, click, type, first, last, prev, next, children, parent, etc.

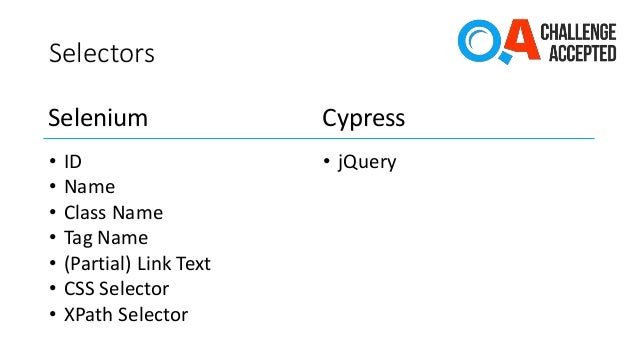
Cypress uses jQuery selectors to locate elements, so you can have things like contains, nth-child, .class, #id, [name*=”value”] (and all variations). A very interesting and sometimes useful feature is that you can make Cypress click hidden elements with click({force: true}), Cypress gives you an error that element is not clickable from a user point of view, and you can choose to find another element or just force the click. Also, you can click multiple elements with click({multiple: true}).

Explore Cypress API

When every project is created for the first time, Cypress installs examples for all their APIs. Those are very good and extensive. I have preserved their examples in the current project and they are available in cypress/examples folder. You can run all the examples with yarn cypress:examples:run command. You can explore them one by one in the Test Runner, which can be opened with yarn cypress:examples:open command.

Page Object Model

As mentioned in the main topic, Cypress recommends using custom commands instead of Page Objects. I do not like this idea, so I use page objects, as I believe they make the code more focused. Here is an example of a page object I am conformable with:

export default class AboutPage {
  constructor() {
    this.elements = {
      navigation: () => cy.getSilent('a[href$=about]'),
      paragraph: index => cy.getSilent('section.m-3 div p').eq(index),
    };
  }

  goTo() {
    cy.visit('/');
    this.elements.navigation().click();
  }

  /**
   * @param {string} version
   * @param {Date} datetime
   */
  verifyPage(version, datetime) {
    this.elements.paragraph(0)
      .should('text', 'Welcome to the about page.');
    this.elements.paragraph(1)
      .should('text', `Current API version is: ${version}`);
    this.elements.paragraph(2)
      .should('text', `Current time is: ${datetime.toISOString()}`);
  }
}

Clock

Cypress allows you to modify the clock in the browser. For e.g. About page of the application under test shows the current time. It makes much more easy to validate the visualization in case you control the current time. Otherwise, you have to parse the time and put some thresholds in the verifications.

Stub response

Another very handy feature is to be able to stub the response that API is supposed to return. In this way, you can very easily test for situations like timeout, incorrect response, error in response, etc.

Clock and Stub example

I have combined clock and stubbing into one example. The test suite file is cypress/tests/stub/response_and_clock_spec.js. The cy.clock(datetime.getTime()); sets the date to one you need. The cy.route(‘GET’, ‘/api/version’, version); simulates that API returns the version as a response. In the current case, it is a plain string, but in general case, this s JSON object.

response_and_clock_spec.js

import AboutPage from '../../pages/about_page';

describe('Check about page', () => {
  it('should show correct stubbed data and clock', () => {
    const aboutPage = new AboutPage();
    const version = '2.33';
    const datetime = new Date('2014-07-22T15:24:00');

    cy.server();
    cy.route('GET', '/api/version', version);
    cy.clock(datetime.getTime());

    aboutPage.goTo();

    aboutPage.verifyPage(version, datetime);
  });
});

about_page.js

  verifyPage(version, datetime) {
    this.elements.paragraph(0)
      .should('text', 'Welcome to the about page.');
    this.elements.paragraph(1)
      .should('text', `Current API version is: ${version}`);
    this.elements.paragraph(2)
      .should('text', `Current time is: ${datetime.toISOString()}`);
  }

Running custom Node.js code

Cypress runs into the browser, this is its biggest strength as you have direct access to your application and the browser. This is its weakness as well because the browser is much restrictive in terms of running code. In order to run custom Node.js code, you have to wrap it as a task. The Cypress task accepts only one argument, so if you need to pass more, you have to wrap them in a JSON object. The task should also return a promise. Tasks are registered into cypress/plugins/index.js file. See examples below. Task copyFile is used in cypress_loggin.js, a parameter that is passed to it is a JSON object with from and to keys. This task is registered with Cypress in index.js. Implementation is done in tasks.js where actual Node.js code is used to manipulate the file system and a Promise is returned.

cypress_logging.js

cy.task('copyFile', {
  from: `cypress/screenshots/${screenshotFilename}`,
  to: getFilePath(screenshotFilename),
});

index.js

const tasks = require('./tasks');

module.exports = (on, config) => {
  // `on` is used to hook into various events Cypress emits
  on('task', {
    copyFile: tasks.copyFile,
  });

  // `config` is the resolved Cypress config
  const newConfig = config;
  newConfig.watchForFileChanges = false;

  return newConfig;
};

tasks.js

const fs = require('fs');

const copyFile = args =>
  new Promise(resolve => {
    if (fs.existsSync(args.from)) {
      fs.writeFileSync(args.to, fs.readFileSync(args.from));
      resolve(`File ${args.from} copied to ${args.to}`);
    }
    resolve(`File ${args.from} does not exist`);
  });

module.exports = { copyFile };

Working with promises

Cypress is based on promises. Each Cypress command returns a command which is similar to a promise, but actually is different, read mode in Commands Are Not Promises. If you want to access the value from the previous operation you have to unwrap it with a then() method. If you have several dependencies then this nesting becomes bigger and bigger. This is why I have adopted some code from Nicholas Boll to avoid nesting. The article above is about using async/await but actually, it is not going to work with my custom logging, I will write in the next section. Initially, I started using directly the plugin from Nicholas, but I have observed strange bugs where a test fails but is not reported as such, so I modified it and it is proved stable now.

See examples below. The standard way of doing it is by unwrapping the command with the then() method. This is working but can get really ugly if you have too many nested unwrappings. The option is to use promisify() which wraps the Cypress command into a promise. The promise is then resolved only inside some other Cypress command, such as cy.log() or custom command cy.apiGetPerson(). If you print it directly the result in the console is a Promise.

with unwrap

it('should work with regular unwrap', () => {
  const person = new Person();
  // This is a command
  cy.apiSavePerson(person).then(personId => {
    // Value is unwrapped and printed properly
    cy.log(personId);
    console.log(personId);

    // Value is passed unwrapped
    cy.apiGetPerson(personId).then(res => cy.log(res));
  });
});

with promisify()

it('should work with promisify', () => {
  const person = new Person();
  // This is a promise
  const personId = cy.apiSavePerson(person).promisify();
  // Cypress internally resolves the promise
  cy.log(personId);
  // Prints a Promise
  console.log(personId);
  // Value is accessible after unwrap
  personId.then(pid => console.log(pid));

  // Cypress internally unwraps the value
  cy.apiGetPerson(personId).then(res => cy.log(res));
});

cypress_promisify.js

function promisify(chain) {
  return new Cypress.Promise((resolve, reject) => {
    chain.then(resolve);
  });
}

before(function() {
  cy.wrap('').__proto__.promisify = function() {
    return promisify(this);
  };
});

Working with async/await

The code above should work with async/await, which is an amazing JavaScript feature. It does work but it messes up with the custom logging I have described into Testing with Cypress – Custom logging of errors and JUnit results post. The code below works, but the custom logging is not triggered. So I would say, do not use async/await if you need those customizations. The bigger issue is that async/await does not seem to work in Electron, cy.apiGetPerson() is actually not invoked if you run the code in Electron browser.

it('should work with async/await', async () => {
  const person = new Person();
  // This is a resolved promise
  const personId = await cy.apiSavePerson(person).promisify();
  // Value is wrapped and printed properly
  cy.log(personId);
  console.log(personId);

  // Value is passed unwrapped
  cy.apiGetPerson(personId).then(res => cy.log(res));
});

Full API documentation

Cypress has very good and extensive documentation, you can read more at Cypress API article.

Conclusion

Cypress has a rich API which requires some time investments to get used to. You have good things like controlling the clock of the browser, controlling the API response from the backend. Good thing is that you have a way to run whatever code you want in your tests, but it has to wrapped as a task, otherwise you cannot just run any code in the browser.

Related Posts

Read more...

Testing with Cypress – lessons learned in a complete framework

Last Updated on by

Post summary: In the current post I will share some lessons I’ve learned using Cypress for quite a long time. Along this journey, I created a framework which solves some of the pain points that Cypress has.

Introduction

More than a year ago I made a bold presentation about Cypress. Back then I had been using Cypress on a small and very nice React application, and I was fascinated by the tool. You can read the presentation content in Cypress vs. Selenium, is this the end of an era? post.  Now more than a year later and 10K lines of test code I am still fascinated by Cypress and also I have discovered several things that were causing me pain during my work. In the current post, I will try to write for some of them, some of them I truly had forgotten. In the course of using Cypress, I had decided to change things I do not like and make them in the way I really enjoy it. The result of this is a framework, maybe this is too overrated, more likely a set of helper files which you can pick and directly use in your project. The code is located in cypress-testing-framework GitHub repository.
Post in the series

This is the first of series of posts dedicated to testing with Cypress and making your tests easier to write. All posts from the series are:

Application under test

In order to demonstrate some of the features, I have built a very simple React application. It has a backend that manipulates the data and the React application is consuming the backend APIs. More about the application itself can be found in Testing with Cypress – Build a React application with Node.js backend post.

Cypress API

Cypress has a rich API, offering lots of functionality. So far many of us are very used to Selenium, and it is a little surprise when you first deal with Cypress. There is some ramp-up time needed. Once you get acknowledged, things start to happen pretty fast and easy. Read more about the API along with some examples Testing with Cypress – Basic API overview post.
Page Object Model

Cypress does not recommend using POM but prefers using Cypress custom commands instead. See а very good and justified post on the topic, named Stop using Page Objects and Start using App Actions. Although the justification seems very logical, I do not agree with that approach. I still use custom commands, but not as a replacement of page objects, I am not giving up the Page Object Model. It gives me more focus, while with custom commands you can easily start duplicate functionality. Check an example of a Page Object Model I am comfortable with in Testing with Cypress – Basic API overview post.

Test Runner going out of memory

This is my biggest pain. I have tried a lot to overcome this but I could not find any solution. It happens in case of a long test suite with lots of actions in it. Cypress keeps a before/after version of the page on every action, memory drains pretty fast and the browser crashes with Aw snap error.

The most recommended option is to use numTestsKeptInMemory to reduce the memory footprint, but then you need it to be at least one, so you can debug and inspect data into the console.

I also tried to pass –max-old-space-size to Node process. If you pass it to Cypress directly it crashes, so what I did was to rename the node executable to node_exec, and then create a new file named node in which I put node_exec –max-old-space-size $@ to forward all arguments to node executable. This did not help either. 

Finally, I settled with the option to have custom commands to locate elements, which suppress more of the logging with {log: false}. Before/after version of locating the element is not needed, a snapshot is needed after a click or other significant action. Note that this log: false gave me a hard time when using cy.get because it was resetting the default timeout, so I had to pass the timeout as an option as well.

Cypress.Commands.add('getSilent', locator =>
  cy.get(locator, {
    log: false,
    timeout: Cypress.config('defaultCommandTimeout'),
  }),
);

This workaround did not solve the out of memory issue either, just allowed me to have a longer scenario before the Test Runner crashes.

On the other hand, this limitation is kind of a motivation for you to plan better, make more focused and short test suites.

Cypress error logging and JUnit results

Cypress does not provide very good logging, the stack trace is practically useless, as your code is wrapped into Cypress’ code. In order to work around this, I use some custom code which collects Cypress commands and then when a test fails it dumps the commands to a custom log file and a screenshot. The same code also creates custom JUnit test result files and it inserts the errors collected. Custom files are saved into cypress/logs folder of the project. You can read more about this custom logging in Testing with Cypress – Custom logging of errors and JUnit results post.

Rerun failed tests

Although Cypress is very stable, it still happens that some tests fail from time to time. I have added a task to rerun failed tests. This is done with yarn cypress:retry. This task iterates all custom created JUnit XMLs described in the previous section and makes a list of all tests that had failed. This list is saved into a file named retry-output.txt in cypress/logs folder. Those files are run again. The internal command that is called by retry code is yarn cypress:run –spec=’cypress/tests/TestSuite.js’. The same command you can use manually to run a single test suite or more using an asterisk as a wildcard.

Code coverage

Code coverage is not mandatory, more likely a nice to have a metric, we try to monitor and improve on. Read more about code coverage in What about code coverage post. For capturing code coverage Istanbul is used. Code coverage is described in more details in Testing with Cypress – Code coverage with Istanbul post.

Generate reports

An HTML report is generated in the end, it is invoked with yarn cypress:report command. This command relies on custom JUnit XMLs generated during the test run. You can read more details in Testing with Cypress – Custom logging of errors and JUnit results post.

Running tests in parallel

Cypress supports running tests in parallel. This is done with –parallel option when you run your tests. In order to do so, you need a subscription to Cypress Dashboard. There are various subscription plans, which are quite affordable. The idea is that Cypress records all your test runs and based on the timing and the available machines, it distributes evenly the tests across your machines. You can read more in Cypress Parallelization article. I have not tried that and also I do not know how it is going to work with current customizations I am doing in the current post.

Another option is to do the parallelism on your own. For this purpose, xargs Linux command can be used. The command that you run under Linux is:

find ./cypress/tests -name "*_spec.js" | xargs -n1 -P4 bash -c 'yarn cypress:run --spec="$@"' --

Where the P4 is the number you threads you want to have. The command finds all files ending with _spec.js with each if it, it invokes Cypress with a given number of simultaneous threads. Note that this parallelization is not very stable in case of Docker container. Randomly there are issues with Xvfb frame buffer.

What worked for me is to have a docker-compose-yml file with several Cypress services. Each one of them is running a group of the tests, which I manually split. All services share the same volume so results are kept in one place. After those services finish, then another service is run which retries failed tests and aggregates the results and the code coverage. This service is sharing the same volume so it has access to all the test results.

End to end process

To put the bits together. The process suggested in the current post consists of the following steps:

  • yarn cypress:run – run the tests. During the run JUnit XML files are generated. In order to speed up tests can be run in parallel as well. Set TEST_CODE_COVERAGE=true is code coverage is needed.
  • yarn cypress:retry – retry failed tests, based on the JUnit XMLs generated from the previous step. You can retry twice if you need to.
  • yarn cypress:report – generate code coverage report, HTML report with results and also semaphore file that indicates if the tests passed or not.

Conclusion

Cypress is a great tool, I strongly recommend it. It is very stable and reliable. With the improvements, you can find with this series of posts, you can make automation with Cypress even more effective, reliable and enjoyable. Very good article with useful Cypress tips is Bahmutov’s Cypress tips and tricks, I suggest you read it as well.

Related Posts

Read more...

Performance testing in the browser

Last Updated on by

Post summary: Approaches for performance testing in the browser using Puppeteer, Lighthouse, and PerformanceTiming API.

In the current post, I will give some examples of how performance testing can be done in the browser using different metrics. Puppeteer is used as a tool for browser manipulation because it integrates easily with Lighthouse and DevTools Protocol. I have described all the tools before giving any examples. The code can be found in GitHub sample-performance-testing-in-browser repository.

Why?

Many things can be said on why do we do performance testing and why especially the browser. In How to do proper performance testing post I have outlined idea how to cover the backend. Assuming it is already optimized, and still, customer experience is not sufficient it is time to look at the frontend part. In general, performance testing is done to satisfy customers. It is up to the business to decide whether performance testing will have some ROI or not. In this article, I will give some ideas on how to do performance testing of the frontend part, hence in the browser.

Puppeteer

Puppeteer is a tool by Google which allows you to control Chrome or Chromium browsers. It works over DevTools Protocol, which I will describe later. Puppeteer allows you to automate your functional tests. In this regards, it is very similar to Selenium but it offers many more features in terms of control, debugging, and information within the browser. Over the DevTools Protocol, you have programmatically access to all features available in DevTools (the tool that is shown in Chrome when you hit F12). You can check Puppeteer API documentation or check advanced Puppeteer examples such as JS and CSS code coverage, site crawler, Google search features checker.

Lighthouse

Lighthouse is again tool by Google which is designed to analyze web apps and pages, making a detailed report about performance, SEO, accessibility, and best practices. The tool can be used inside Chrome’s DevTools, standalone from CLI (command line interface), or programmatically from Puppeteer project. Google had developed user-centric performance metrics which Lighthouse uses. Here is a Lighthouse report example run on my blog.

PerformanceTimings API

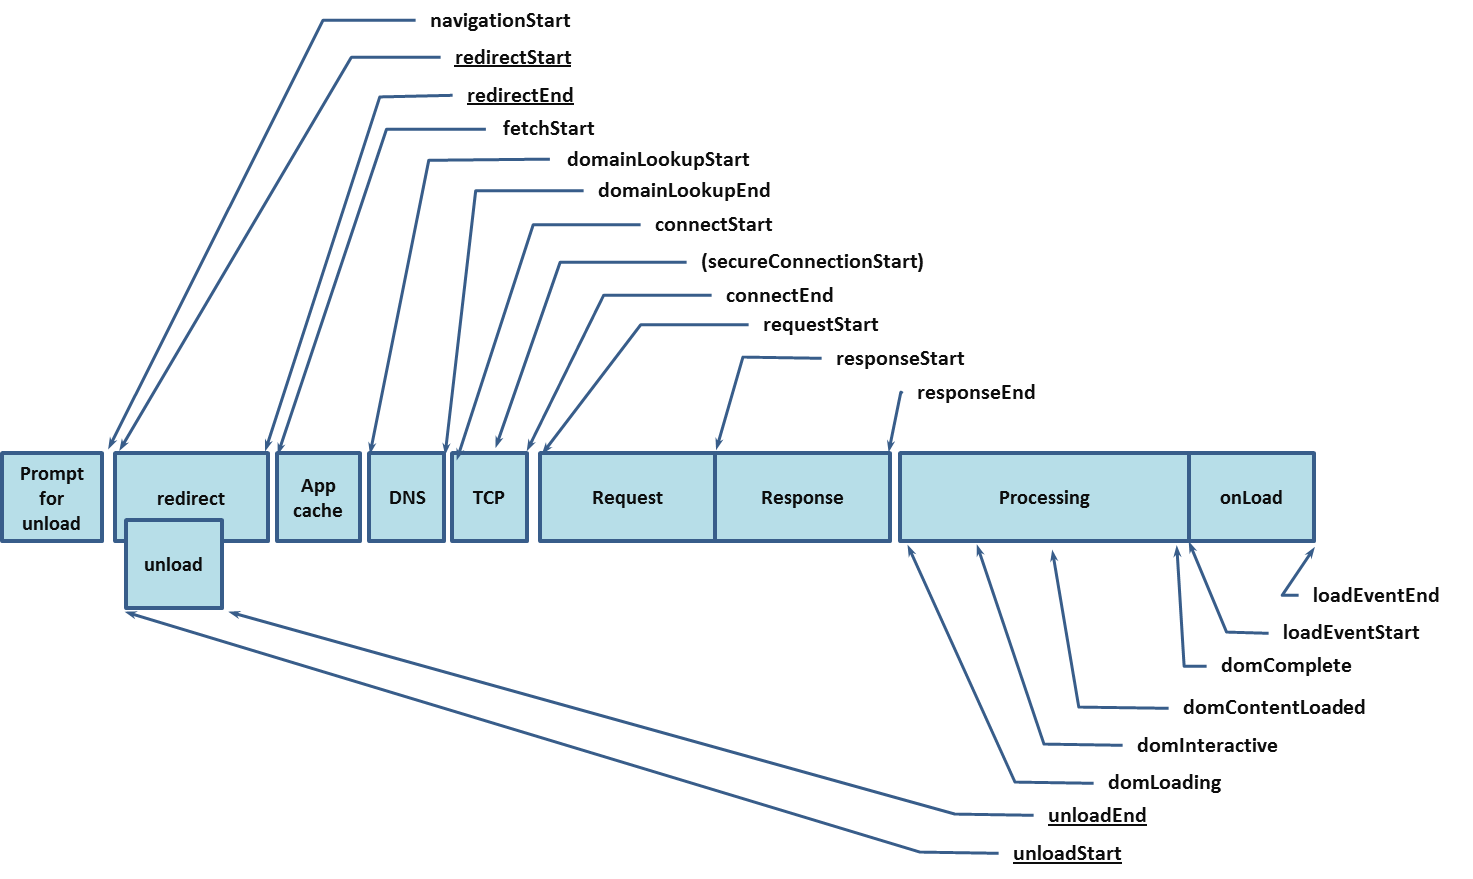
W3C have Navigation Timing recommendation which is supported by major browsers. The interesting part is the PerformanceTiming interface, where various timings are exposed.

DevTools Protocol

DevTools Protocol comes by Google and is a way to communicate programmatically with DevTools within Chrome and Chromium, hence you can instrument, inspect, debug, and profile those browsers.

Examples

Now comes the fun part. I have prepared several examples. All the code is in GitHub sample-performance-testing-in-browser repository.

  • Puppeteer and Lighthouse – Puppeteer is used to login and then Lighthouse checks pages for logged in user.
  • Puppeteer and PerformanceTiming API – Puppeteer navigates the site and gathers PerformanceTiming metrics from the browser.
  • Lighthouse and PerformanceTiming API – comparison between both metrics in Lighthouse and NavigationTiming.
  • Puppeteer and DevTools Protocol – simulate low bandwidth network conditions with DevTools Protocol.

Before proceeding with the examples I will outline helper functions used to gather metrics. In the examples, I use Node.js 8 which supports async/await functionality. With it, you can use an asynchronous code in a synchronous manner.

Gather single PerformanceTiming metric

async function gatherPerformanceTimingMetric(page, metricName) {
  const metric = await page.evaluate(metric => 
     window.performance.timing[metric], metricName);
  return metric;
}

I will not go into details about Puppeteer API. I will describe the functions I have used. Function page.evaluate() executes JavaScript in the browser and can return a result if needed. window.performance.timing returns all metrics from the browser and only needed by metricName one is returned by the current function.

Gather all PerformaceTiming metrics

async function gatherPerformanceTimingMetrics(page) {
  // The values returned from evaluate() function should be JSON serializable.
  const rawMetrics = await page.evaluate(() => 
    JSON.stringify(window.performance.timing));
  const metrics = JSON.parse(rawMetrics);
  return metrics;
}

This one is very similar to the previous. Instead of just one metric, all are returned. The tricky part is the call to JSON.stringify(). The values returned from page.evaluate() function should be JSON serializable. With JSON.parse() they are converted to object again.

Extract data from PerformanceTiming metrics

async function processPerformanceTimingMetrics(metrics) {
  return {
    dnsLookup: metrics.domainLookupEnd - metrics.domainLookupStart,
    tcpConnect: metrics.connectEnd - metrics.connectStart,
    request: metrics.responseStart - metrics.requestStart,
    response: metrics.responseEnd - metrics.responseStart,
    domLoaded: metrics.domComplete - metrics.domLoading,
    domInteractive: metrics.domInteractive - metrics.navigationStart,
    pageLoad: metrics.loadEventEnd - metrics.loadEventStart,
    fullTime: metrics.loadEventEnd - metrics.navigationStart
  }
}

Time data for certain events are compiled from raw metrics. For e.g., if DNS lookup or TCP connection times are slow, then this could be some network specific thing and may not need to be acted. If response time is very high, then this is indicator backend might not be performing well and needs to be further performance tested. See How to do proper performance testing post for more details.

Gather Lighthouse metrics

const lighthouse = require('lighthouse');

async function gatherLighthouseMetrics(page, config) {
  // ws://127.0.0.1:52046/devtools/browser/675a2fad-4ccf-412b-81bb-170fdb2cc39c
  const port = await page.browser().wsEndpoint().split(':')[2].split('/')[0];
  return await lighthouse(page.url(), { port: port }, config).then(results => {
    delete results.artifacts;
    return results;
  });
}

The example above shows how to use Lighthouse programmatically. Lighthouse needs to connect to a browser on a specific port. This port is taken from page.browser().wsEndpoint() which is in format ws://127.0.0.1:52046/devtools/browser/{GUID}. It is good to delete results.artifacts; because they might get very big in size and are not needed. The result is one huge object. I will talk about this is more details. Before using Lighthouse is should be installed in a Node.js project with npm install lighthouse –save-dev.

Puppeteer and Lighthouse

In this example, Puppeteer is used to navigating through the site and authenticate the user, so Lighthouse can be run for a page behind a login. Lighthouse can be run through CLI as well but in this case, you just pass and URL and Lighthouse will check it.

puppeteer-lighthouse.js

const puppeteer = require('puppeteer');
const perfConfig = require('./config.performance.js');
const fs = require('fs');
const resultsDir = 'results';
const { gatherLighthouseMetrics } = require('./helpers');

(async () => {
  const browser = await puppeteer.launch({
    headless: true,
    // slowMo: 250
  });
  const page = await browser.newPage();

  await page.goto('https://automationrhapsody.com/examples/sample-login/');
  await verify(page, 'page_home');

  await page.click('a');
  await page.waitForSelector('form');
  await page.type('input[name="username"]', 'admin');
  await page.type('input[name="password"]', 'admin');
  await page.click('input[type="submit"]');
  await page.waitForSelector('h2');
  await verify(page, 'page_loggedin');

  await browser.close();
})();

verify()

const perfConfig = require('./config.performance.js');
const fs = require('fs');
const resultsDir = 'results';
const { gatherLighthouseMetrics } = require('./helpers');

async function verify(page, pageName) {
  await createDir(resultsDir);
  await page.screenshot({
    path: `./${resultsDir}/${pageName}.png`,
    fullPage: true
  });
  const metrics = await gatherLighthouseMetrics(page, perfConfig);
  fs.writeFileSync(`./${resultsDir}/${pageName}.json`,
    JSON.stringify(metrics, null, 2));
  return metrics;
}

createDir()

const fs = require('fs');

async function createDir(dirName) {
  if (!fs.existsSync(dirName)) {
    fs.mkdirSync(dirName, '0766');
  }
}

A new browser is launched with puppeteer.launch(), arguments { headless: true, //slowMo: 250 } are put for debugging purposes. If you want to view what is happening then set headless to false and slow the motions with slowMo: 250, where time is in milliseconds. Start a new page with browser.newPage() and navigate to some URL with page.goto(‘URL’). Then verify() function is invoked. It is shown on the second tab and will be described in a while. Next functionality is used to log in the user. With page.click(‘SELECTOR’), where CSS selector is specified, you can click an element on the page. With page.waitForSelector(‘SELECTOR’) Puppeteer should wait for the element with the given CSS selector to be shown. With page.type(‘SELECTOR’, ‘TEXT’) Puppeteer types the TEXT in the element located by given CSS selector. Finally browser.close() closes the browser.

So far only Puppeteer navigation is described. Lighthouse is invoked in verify() function. Results directory is created initially with createDir() function. Then a screenshot is taken on the full page with page.screenshot() function. Lighthouse is called with gatherLighthouseMetrics(page, perfConfig). This function was described above. Basically, it gets the port on which DevTools Protocol is currently running and passes it to lighthouse() function. Another approach could be to start the browser with hardcoded debug port of 9222 with puppeteer.launch({ args: [ ‘–remote-debugging-port=9222’ ] }) and pass nothing to Lighthouse, it will try to connect to this port by default. Function lighthouse() accepts also an optional config parameter. If not specified then all Lighthouse checks are done. In the current example, only performance is important, thus a specific config file is created and used. This is config.performance.js file.

Puppeteer and PerformanceTiming API

In this example, Puppeteer is used to navigating the site and extract PerformanceTiming metrics from the browser.

const puppeteer = require('puppeteer');
const { gatherPerformanceTimingMetric,
  gatherPerformanceTimingMetrics,
  processPerformanceTimingMetrics } = require('./helpers');

(async () => {
  const browser = await puppeteer.launch({
    headless: true
  });
  const page = await browser.newPage();
  await page.goto('https://automationrhapsody.com/');

  const rawMetrics = await gatherPerformanceTimingMetrics(page);
  const metrics = await processPerformanceTimingMetrics(rawMetrics);
  console.log(`DNS: ${metrics.dnsLookup}`);
  console.log(`TCP: ${metrics.tcpConnect}`);
  console.log(`Req: ${metrics.request}`);
  console.log(`Res: ${metrics.response}`);
  console.log(`DOM load: ${metrics.domLoaded}`);
  console.log(`DOM interactive: ${metrics.domInteractive}`);
  console.log(`Document load: ${metrics.pageLoad}`);
  console.log(`Full load time: ${metrics.fullTime}`);

  const loadEventEnd = await gatherPerformanceTimingMetric(page, 'loadEventEnd');
  const date = new Date(loadEventEnd);
  console.log(`Page load ended on: ${date}`);

  await browser.close();
})();

Metrics are extracted with gatherPerformanceTimingMetrics() function described above and then data is collected from the metrics with processPerformanceTimingMetrics(). In the end, there is an example of how to extract one metric such as loadEventEnd and display it as a date object.

Lighthouse and PerformanceTiming API

const puppeteer = require('puppeteer');
const perfConfig = require('./config.performance.js');
const { gatherPerformanceTimingMetrics,
  gatherLighthouseMetrics } = require('./helpers');

(async () => {
  const browser = await puppeteer.launch({
    headless: true
  });
  const page = await browser.newPage();
  const urls = ['https://automationrhapsody.com/',
    'https://automationrhapsody.com/examples/sample-login/'];

  for (const url of urls) {
    await page.goto(url);

    const lighthouseMetrics = await gatherLighthouseMetrics(page, perfConfig);
    const firstPaint = parseInt(lighthouseMetrics.audits['first-meaningful-paint']['rawValue'], 10);
    const firstInteractive = parseInt(lighthouseMetrics.audits['first-interactive']['rawValue'], 10);
    const navigationMetrics = await gatherPerformanceTimingMetrics(page);
    const domInteractive = navigationMetrics.domInteractive - navigationMetrics.navigationStart;
    const fullLoad = navigationMetrics.loadEventEnd - navigationMetrics.navigationStart;
    console.log(`FirstPaint: ${firstPaint}, FirstInterractive: ${firstInteractive}, 
      DOMInteractive: ${domInteractive}, FullLoad: ${fullLoad}`);
  }

  await browser.close();
})();

This example shows a comparison between Lighthouse metrics and PerformanceTiming API metrics. If you run the example and compare all the timings you will notice how much slower the site looks according to Lighthouse. This is because it uses 3G (1.6Mbit/s download speed) settings by default.

Puppeteer and DevTools Protocol

const puppeteer = require('puppeteer');
const throughputKBs = process.env.throughput || 200;

(async () => {
  const browser = await puppeteer.launch({
    executablePath: 
      'C:\\Program Files (x86)\\Google\\Chrome\\Application\\chrome.exe',
    headless: false
  });
  const page = await browser.newPage();
  const client = await page.target().createCDPSession();

  await client.send('Network.emulateNetworkConditions', {
    offline: false,
    latency: 200,
    downloadThroughput: throughputKBs * 1024,
    uploadThroughput: throughputKBs * 1024
  });

  const start = (new Date()).getTime();
  await client.send('Page.navigate', {
    'url': 'https://automationrhapsody.com'
  });
  await page.waitForNavigation({
    timeout: 240000,
    waitUntil: 'load'
  });
  const end = (new Date()).getTime();
  const totalTimeSeconds = (end - start) / 1000;

  console.log(`Page loaded for ${totalTimeSeconds} seconds 
    when connection is ${throughputKBs}kbit/s`);

  await browser.close();
})();

In the current example, network conditions with restricted bandwidth are emulated in order to test page load time and perception. With executablePath Puppeteer launches an instance of Chrome browser. The path given in the example is for Windows machine. Then a client is made to communicate with DevTools Protocol with page.target().createCDPSession(). Configurations are send to browser with client.send(‘Network.emulateNetworkConditions’, { }). Then URL is opened into the page with client.send(‘Page.navigate’, { URL}). The script can be run with different values for throughput passed as environment variable. Example waits 240 seconds for the page to fully load with page.waitForNavigation().

Conclusion

In the current post, I have described several ways to measure the performance of your web application. The main tool used to control the browser is Puppeteer because it integrated very easily with Lighthouse and DevTools Protocol. All examples can be executed through the CLI, so they can be easily plugged into CI/CD process. Among the various approaches, you can compile your preferred scenario which can be run on every commit to measure if the performance of your application has been affected by certain code changes.

Related Posts

Read more...

What is The Test Mushroom and how to improve your testing

Last Updated on by

Post summary: In contrast to Test Pyramid, Test Mushroom shows a test portfolio which is restricted to costly and slow UI tests only. In the current post, I will describe approaches to act on your Test Mushroom hence improve your testing.

Test Pyramid

Test pyramid illustrates how your test portfolio is good to look like. The important thing about the test pyramid is the higher in the test pyramid the more brittle and expensive to maintain the tests are. In the bottom of the pyramid are the unit tests. They are fast and test most of the functionality in your code. By integration tests is meant the following thing. Defacto the standard now for web applications is to use some JavaScript UI framework that manipulates data from different APIs. With integration testing, we want to be in control of this data. We want for e.g. to test how web application behaves when API returns an error. By stubbing the data web application works with it is possible to fully test the web application. UI/E2E tests are the ones executed against deployed, configured, integrated and working web application. They are slow and flaky, thus they should be limited in number. In other versions of test pyramid, there is a layer called service tests, which is below UI and above integration. Those are API tests performed against deployed and working backend. I will not go into details about them, because API tests are by definition very stable.

Test Mushroom

I came up with this term when giving a presentation for Cypress, you can see more in Cypress vs. Selenium, is this the end of an era? post. This term was meant to be a funny and ironic description of a test portfolio that makes testing big pain because the quality of releases totally depends on UI tests. The mushroom leg represents unit and integration tests. It is shown with a dotted line as such test are totally missing. UI tests are slow and flaky, every release sign off takes a lot of time for debugging failed tests. Every release has a high risk of failure. This is very similar to the Test Ice-Cream Cone, with the difference that in case of Test Mushroom integration and unit tests are missing.

Need for an action

Whether it is a test mushroom or test ice-cream cone, it is not important. The important is both represent a situation where product quality depends on brittle and flaky UI tests. This should be acted upon in order to reduce the release related risk. In the current post, I will suggest some approaches how to act in this situation and put yourself in a better position. Below is a high-level list of what you can do. Each item from the list will be described with greater details later in the current post.

  • Refactor and optimize UI tests
  • Provision dedicated test environment
  • Increase integration testing
  • Unit testing and shift left

Refactor and optimize UI tests

The first thing you can do is act on UI tests because you have full control over them. Go over current tests and do a full review on them. In most of the cases, there are duplicated tests. With time being people add new tests and they keep piling up. This happens because it is easier to add new test rather than inspecting already existing ones and fit your tests scenario inside. You need to optimize your current tests. It might not happen immediately, it can be done a single step at a time, but you should do it. If several test scenarios can be fit into one automated test, then definitely do it. There are theories that say one test should test one thing only. I totally agree with this statement, but it is only relevant for the unit tests. For UI/E2E/functional tests this statement is more likely a good wish. UI tests are expensive, so we should optimize them as much as possible.

Classification tree test method

You should look for more details for classification tree method. I will give a short example. Imagine you have an e-commerce website. In this site, there are 3 main types of products: single product, a product with variations, e.g. several colors, and product set. This site offers 3 different deliveries, one international and two domestic shipping methods. Users can pay with Paypal, Visa, MasterCard, and Amex. With classification tree method you will have 3 different classifications: product type, shipping method, and payment method. The full test cases that can be done is a cartesian product from values of all classifications. In current example this 3 (product types) x 3 (shipping methods) x 4 (payment methods) = 36 full combinations. Minimum test cases that can be done though are 4, or the classification with most values. The 4 test cases we definitely must do are:

  • Single product with international delivery and PayPal
  • Blue variation product with domestic delivery #1 and Visa
  • Red variation product with international delivery and MasterCard
  • A product set with domestic delivery #2 and Amex

Soft assertions

Once you optimize tests number and workflow you would like to make as many assertions as possible while you are on each page. In this regards, so-called soft assertions can be used. Opposing to traditional unit testing asserts, where the test fails immediately when an error is found, a soft assertion is one that does not fail in case of a not critical problem. This provides the ability to execute all the steps in the test and then investigate the issues. Soft assertions that do not fail JUnit test and Soft assertions for C# unit testing frameworks (MSTest, NUnit, xUnit.net) posts can give you more details how to do it in Java and C#.

Rename test methods

It is good to rename your test methods to be as much descriptive as possible. It does not matter that method name will contradict with best practices for method naming because those are test methods. If your tests fail you can identify them very easily just by the name of the failed method.

Use smarter waits

I get really upset when I see in test something like Thread.Sleep(5000). You should never ever use such waits. Not only they are slowing you tests down but they will make the test fail if for some reason website is taking 6 seconds to render. Selenium offers explicit and implicit waits, you should be very familiar with them. Another approach is to use even smarter mechanisms. Like, check for jQuery opened connections or for the existence of some kind of loader on your web application. See Efficient waiting for Ajax call data loading with Selenium WebDriver post for more details. Cypress, on the other hand, eliminates waiting at all, as it knows what happens in the browser and it gives you the element once it is shown.

Retry failed tests

If you do not already have, you definitely need a retry mechanism for your tests. In Retry JUnit failed tests immediately post, I have described how this can be done for JUnit. In Testing with Cypress – lessons learned in a complete framework post, I have described a way to retry failed tests.

Screenshot failed tests

In order to ease yourself debugging a screenshot is a must. Along with the screenshot, it is good to have page source and URL at which screenshot was captured.

Provision dedicated test environment

In case of a shared environment, it is always possible that someone is doing something while tests are running. It is very good if you can provision a dedicated test environment. You should at any point know which version of the software under test are deployed on it and no one should mess with the test environment. If you have an application that consists of a database and API that is consumed by a UI then you can relatively easy use Docker to get a running test environment. If you are testing some application which is part of a big microservice ecosystem, then it might not be that easy, because you have to have dedicated environment for each dependent microservice, and they can be a big number.

Control test data in the database

Ideally, you want to have full control over the data in the database. In this way you can very easily assert and check for data you know is there. Ono option is in case of an application with own database, it is very easy to have a Docker image with already prefilled test data in the database and use it. If not using preloaded data you can still seed the data with API calls prior to the tests.

Dedicated test environment not only can make your tests more stable but can make them faster. Check Emanuil Slavov’s Need for Speed presentation, this talk is also available in GTAC 2016 video.

Increase integration testing

So far you have optimized your UI tests. If you are satisfied with the results, then maybe no further steps are needed. Remember, we do certain things, not because everybody is doing it but because we need it. If you need more improvements then you can look into integration testing. With term integration testing I mean testing of your application or parts of it by stubbing or mocking external dependencies. Below are several suggestions how you can do this.

JavaScript rich web application

In case of a web application built with some JavaScript framework that consumes the data from external APIs and renders the UI based on the data then there are two approaches to do integration testing. One is to use Cypress, which has a very good feature set for decent integration testing in the browser. See Cypress vs. Selenium, is this the end of an era? post for more details. The other approach is to use external stubs and have your application under test configured to work with the stubs. You can even make your testing framework to start and manage the stubs. See WireMock and Own stubbing sections below.

API backend application

In case of backend application that exposes different APIs for external consumption then the approach for integration testing is to stub or mock its dependencies. Dependency can be a database or external API that is being called. Database stubbing depends on the type of application and database used. For .NET application using Entity Framework, it is possible to mock the framework itself. The good thing about .NET is that it provides so-called TestHost, which can run your application in memory and you can also mock some of your dependencies if you have built your application properly to use inversion of control container. See more in .NET Core integration testing and mock dependencies post. When speaking with colleagues they say Spring framework for Java provides similar functionalities, but I do not have experience with it. In terms of database, it depends which database has been used. If it is MS SQL Server, then one option, besides totally mocking the DB calls, is to use SQL Express (localdb). It runs on Windows machine and is extremely fast. It is very easy to create a new database and then run your application with this database. For MySQL I’ve seen in presentations that it is possible to run it in memory but I haven’t tried this. Mocking dependencies to external applications again can be done either with WireMock or with Own Stubbing. You can have an instance of your application installed in separate integration environment and configured to use stubs instead of real dependency APIs.

Server-side HTML rendering

Integration testing of web application which HTML is rendered on the server and just given to the browser is very similar to the previous section API backend application.

WireMock

WireMock is a simulator for HTTP-based APIs. Some might consider it a service virtualization tool or a mock server. It enables you to stay productive when an API you depend on doesn’t exist or isn’t complete. It supports testing of edge cases and failure modes that the real API won’t reliably produce. And because it’s fast it can reduce your build time from hours down to minutes. I have shown how WireMock can be used in unit tests in Mock/Stub REST API with WireMock for better unit testing post. It can be run as standalone Java application with different endpoints and responses configured. So you can make WireMock reply differently based on the request it receives. This can be synchronized with your tests and you can automate whatever scenarios you need. Challenge with this approach is to keep both tests and mocked data in sync.

Own stubbing

It is possible to build own stub and configure it with whatever scenarios you want. I have described how you can do this in Java, .NET and Node.js in following posts: Build a RESTful stub server with Dropwizard, Build a REST API with .NET Core 2 and run it on Docker Linux container, and Build a REST API with Express on Node.js and run it on Docker.

Unit testing and shift left

The base of test pyramid are the unit tests. I have many posts on my blog regarding unit testing so in the current post, I will not go into further details about them because this more in development expertise. From my experience, if you have good UI and integration tests, you can have a very good level of quality without unit testing. I will refer to Emanuil Slavov’s Integration Tests Are Awesome post. He had spent a significant amount of time investigating bugs in their bug tracking system and linking them to a layer of testing. He had discovered that only 13% of the bugs they could have caught with unit testing. Another 57% of the bugs they would have caught with API and UI testing. Latter 30% they have discovered could not have been caught with any kind of testing. I guess integration testing can cover some of the 30% uncatchable bugs because you can stub and mock the dependencies and this gives you better flexibility. So this is a good proof that you can go without unit testing. The real benefit of the unit testing though is the Shift Left paradigm. It involves developers in the process of building quality in the application. If developers should write unit tests to their code they catch and fix bugs almost immediately. With the time being developers learn to imply quality in their code. Your UI and integration tests will also catch most of the bugs. The more important is that the process of reporting and fixing bugs caught during UI and integration testing includes more time and effort. This is why writing unit tests are mandatory for any organization that wants to deliver quality products.

Conclusion

This post had started with the funny term of the test mushroom. It later continues with important guidelines how you can improve your testing first by optimizing your UI tests, then develop integration tests, and finally describing why unit testing is important to an organization, because of the Shift Left paradigm which involves developers into building quality to the application.

Related Posts

Read more...

Cypress vs. Selenium, is this the end of an era?

Last Updated on by

Post summary: Blog post about a Cypress talk I did recently on a local conference. The presentation compares Cypress with well knows Selenium.

Background

This weekend I did a small talk about Cypress, named “Cypress vs. Selenium, the end of an era?” on QA Challenge Accepted, a local testing conference. This is my second talk on this conference. In 2016 I spoke about Gatling. I haven’t blogged about my Galing talks because my blog covers the tool very extensively. In Performance testing with Gatling post, there is complete Gatling tutorial. In the current post, I will show most of the slides of my presentation and will describe what I have spoken about. The full Cypress presentation can be found on SlideShare: QA Challenge Accepted 4.0 – Cypress vs. Selenium.

Presentation

Selenium Overview

Selenium is a very well known tool, so I will not get into details about it. I will emphasize on its architecture which will be important for the rest of the presentation. Selenium consists of two components. One is so-called bindings, libraries for different programming languages that we use to write our tests with. The other component is the WebDriver. WebDriver is a program that can manage and fully control a specific browser, for which it is designated. The important bit here is that those two components communicate over HTTP by exchanging JSON payload. This is well defined by WebDriver Protocol, which is W3C Candidate Recommendation. Every command used in tests results to a JSON sent through the network. This network communication happens even if tests are run locally. In this case, requests are sent to localhost behind which there is loopback network interface. Even on localhost request travels to Layer 3 of the OSI Model. Request travels through 5 layers, only layers 1 (physical) and 2 (data link) are skipped.

After the conference, I spoke to Anton Angelov, the founder of Automate The Planet and he pointed out that on some WebDrivers on .NET Core, the resolution from localhost in the request to 127.0.0.1, which is the IPv4 address of loopback interface, can take up to a second. This is, of course, .NET Core specific thing. Anyway, in general, resolving localhost to 127.0.0.1 also needs some time which is added to total execution time.

The bottom line of the slide: By architecture Selenium works through the network and this brings delay, which can sometimes be significant.

Cypress Overview

Cypress is used for UI testing but is not based on Selenium. There are many tools out there which bring a lot of abstractions over the WebDriver, but they are limited to the WebDriver as a technology for browser manipulation. All those tools inherit WebDriver limitations. Cypress has its own mechanism for manipulation DOM in the browser. Cypress runs directly in the browser, no network communication involved. By running directly in the browser Cypress has access to everything in the browser, including your application under test. I do not know a valid reason for this, but in my observations, developers strongly do not like Selenium. Cypress is designed with developers in mind, so it is very developer-friendly. Debugging tests with Cypress is easy, there is so-called travel back in time. I will speak for it later.

The bottom line of the slide: Cypress is made from scratch with its own unique DOM manipulation technology and is made with developers in mind.

How to do it

The bottom line of the slide: It is easy to install Cypress. It is easy to write tests with it. It is very easy to debug tests. It is easy to include it in continuous integration or continuous delivery pipelines.

Debug tests in Cypress Test Runner

Cypress Test Runner is a browser instance in which you see all your tests’ steps on the left-hand side. You can click on any step and in the right-hand side window, the application under test is visualized. Cypress makes DOM snapshot before each test steps, so you can easily inspect them.

The bottom line of the slide: Cypress provides DOM snapshots at each test step for easy test debugging.

Library or Framework

Comparison between both tools now begins. Selenium is a library. If you want to make real UI automation you have to combine it with a unit testing framework or make your own runner; you may want to add assertions library or reporting one. This is handy and gives you great flexibility because if you know what you do you can make miracles. You become a creator! If you don’t know what you do you can very easily shoot yourself in the foot. I think this is mostly because developers hate Selenium. Its usage is not straightforward. In order to start writing tests, you have to do a lot of preparational work. This is something developers do not want to invest in, they invest enough in learning all the frameworks related to their work. They do not want to spend time on several more. Cypress, on the other hand, is a complete framework. You install it and start writing tests. It includes Mocha, very famous JavaScript unit testing framework; Chai is assertions library; Chai-jQuery adds jQuery chainer methods to Chai; Sinon is famous JavaScript mocking library that provides mocks, stubs, and spies; Sinon-Chai brings Chai assertions on stubs and spies.

The bottom line of the slide: Selenium is a library allowing you great flexibility. It requires a lot of preparational work before you can start writing tests. Cypress is a complete framework. You install it and start writing tests.

Test Pyramid

Test pyramid illustrates how your test portfolio should look like. Currently is show a test pyramid for a modern web application. In the bottom are the unit tests. They are fast and test most of the functions in your code. By integration tests is meant the following thing. Defacto the standard now for web applications is to use some JavaScript framework and work with data from APIs. Modern web applications process data from APIs. With integration testing, we want to be in control of this data. We want for e.g. to test how web application behaves when API returns an error. If we have stable and well-tested API this scenario we won’t be able to test in reality. By stubbing the data web application works with it is possible to fully test the web application. UI tests are the one executed against deployed, configured and working web application. They are slow and flaky, thus they are limited in number. Selenium works in the UI part of the pyramid. Cypress is there as well, but Cypress is also very good in Integration tests. The dotted line is mostly a wishful thinking – we have unit testing framework included, why not create some unit tests.

The bottom line of the slide: Selenium works only in the UI part of the test pyramid, while Cypress is involved in UI tests and most important in the integration tests.

Programming languages

There are bindings in almost any programming language existing nowadays. If there is not such, by following WebDriver protocol you can create your own binding. Cypress on the other hand only uses JavaScript and will continue to only use JavaScript. There are two reasons for this. FIrst one is not significant, but it is good your tests code to be as you application under test’s code. The most important reason though is that as I said modern web applications are written in JavaScript frameworks. Developers do know JavaScript, so they can very easily write their own Cypress tests.

The bottom line of the slide: Selenium is available in all programming languages. Developers of modern web application know JavaScript. With Cypress, they can write their own tests.

Selectors

Selenium supports 8 different locators. CSS and XPath are the most powerful ones. Cypress supports jQuery selectors. What you can use as a CSS selector in Selenium, you can directly use as a selector in Cypress. The benefit is that jQuery provides more selectors on hand.
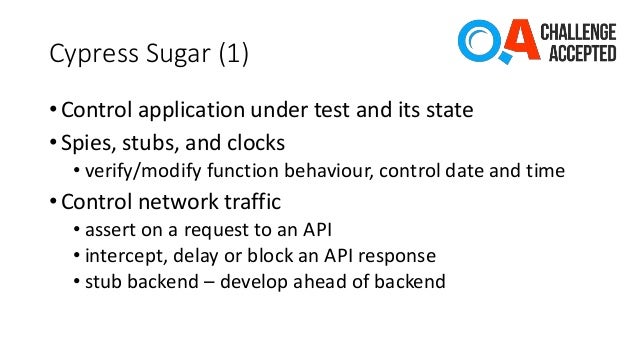
The bottom line of the slide: jQuery selectors give more capabilities than CSS selectors.

Supported Browsers

Selenium supports all significant browsers. You can even create your own browser, make WebDriver for it following WebDriver protocol and your current tests will work exactly the same on this new browser. Cypress at this point supports only Chrome. This is maybe the biggest weakness of the tool. Good thing though is that more than 60% of the web uses Chome. Another good thing is that Firefox support is on its way. IE 11 and Edge support is also on the roadmap but with no clear dates.

The bottom line of the slide: Cypress is weak at cross-browser testing. Cypress team is working through to get better in this area.

Cypress vs. Selenium (1)

Comparison of different characteristics:

  • Speed – Selenium tests are generally slow. WebDriver starting is slow, WebDriver is working slowly. Network operating nature of WebDriver also brings some delay. Cypress is super fast. There is no noticeable delay because of the tool itself.
  • Wait for element – in order to do some effective automation with Selenium, waiting for an element is an important part of your framework. You have to have good error catching mechanism as well as retry logic. It takes significant effort to make tests non-flaky. With Cypress, you do not wait. Cypress runs in the browser and knows what is happening behind the scenes, whether the application under test is still busy. In Cypress, you request the element and you get it when the element is ready, no extra code or logic needed.
  • Remote execution – this is what Selenium is made for. You can use Selenium Grid with different browsers and different browser versions. Cypress does not support remote execution.
  • Parallel execution – Selenium is a library that can manipulate the browser. If you make your code thread safe and use a unit testing framework that supports parallel runs then you will have parallel execution. Selenium does not really care about this. Cypress currently does not support parallel execution. It is possible to do it on your own with Docker images, but this involves additional effort. Currently, Cypress team is working on developing parallel execution, so this will happen soon.
  • Headless – both tools support headless Chrome.

Cypress vs. Selenium (2)

Comparison of different characteristics:

  • Screenshot – both perform equally bad because both make screenshot only of the visible part of the page. In order to get the full page, you need to use external JavaScript libraries to capture page and save it as a screenshot. Selenium is a little bit better on screenshot though, because it gives you screenshot object in your tests and you can save it wherever you want. Cypress makes an automatic screenshot with a fixed name. In order to make second screenshot for one test, you need to do some file manipulations for renaming the previous file.
  • Video – Selenium does not record video. Cypress records video by default when tests are run from command line.
  • Documentation – Selenium documentation for me is ugly and not complete. If one has to get acknowledged with Selenium by reading its documentation only that would be very difficult. Cypress team had invested a lot in the documentation. They have their API well described, they have examples and FAQ page.
  • Community – Selenium is an institution. Everybody is using Selenium. For every problem, you may encounter there are already tens of solutions. Cypress does not have such a community yet, not many people are using it. They have chat though in which Cypress developers answer your queries. This chat gets flooded with information, so you can easily get lost.

Cypress vs. Selenium (3)

Comparison of different characteristics:

  • Execute JS – Selenium allows JavaScript execution and this is fast. I’ve seen frameworks where Selenium is used only for JavaScript execution. Cypress is designed to work with JavaScript. It has full access to everything in the browser, including application under test.
  • Switch tabs – Selenium can switch between two tabs of the same browser, Cypress cannot.
  • Several browsers – Selenium can work with several browser windows, even from different browsers. Cypress can work with only one browser instance.
  • Load extensions – both tools allow you to run your tests with some Chrome extension.
  • Manage cookies – both tools manage cookies equally well.

Test Mushroom

This is some funny, ironic but mostly tragic term I’ve made up. It is made up with an analogy to the test pyramid. This mushroom represents a very common test portfolio where the quality of releases totally depends on UI tests. The mushroom leg represents Unit and Integration tests. It is shown with a dotted line as such test are missing. UI tests are slow and flaky, every release sign off takes a lot of time for debugging failed tests. Every release has a risk of failure.

The bottom line of the slide: There are many real-life scenarios where web application quality depends only on UI tests, which are brittle.Cypress gives you instrumentation to act on integrations test, thus reducing the number of UI ones.

The end of an era?

Now is the time to give an answer to the most interesting part of presentation name. Is this an end of an era? My presentation is not really about the competition between those two tools. Everyone has its strengths and weaknesses. They work perfectly combined together. My main point is and I truly believe it is the end of Developers don’t test era. Selenium may not be their favorite tool, but Cypress is made from developers for developers. It is easy to work with and provides features to speed up test writing. If you try the tool and do not like it, at least try to introduce it to developers in your company.

The bottom line of the slide: Cypress is a tool created by developers for developers. Try to introduce it to developers in your organization.

Cypress Sugar (1)

Those are features that make Cypress interesting tool and that make integration testing easy. Cypress runs directly in the browser and has access to everything in the browser, including application under test. Sometimes Selenium tests go through several pages just to bring the application in some desired state. With Cypress, you can programmatically bring the application to this desired state. Cypress provides spies, stubs, and clocks. With spies, you can verify if given JavaScript function has been called, with what arguments or how many times. Stubs allow you to change the default behavior of JavaScript functions and feed to the application under test the data that you need. For e.g. window.fetch is the new way of getting data from API. This can be very easily stubbed. Cypress provides control over the clock in the browser. If you have some animation, instead of waiting for it, you can move the clock forcing animation to show. Cypress allows you to have full control over the network traffic within the browser. You can assert on XMLHttpRequest to an API, verifying that API is called with proper arguments. You can intercept, change, delay, or block response from the API. This allows you to cover various integration scenarios. With Cypress, you can develop even though there is no backend ready yet. You can do TDD (test driven development), create tests and stub the data from missing API in them, develop the UI and then run the tests until they get green.

The bottom line of the slide: Cypress provides great functionalities for stubbing JavaScript functions and control on network traffic within the browser. Those can be used for creating various integration tests.

Cypress Sugar (2)

The essential functionality of most applications is hidden behind a login. Login through the UI slows up the tests. Cypress allows you to send a login request to the backend and it extracts cookies from the response, injects them in the browser and from now on the user is logged in tests. This request takes browser user agent and existing cookies but skips some security limitations, such as CORS (cross-origin resource sharing). Same can be done with Selenium. You can use some HTTP client, send login request, get the response and inject the cookies in the browser. With Selenium, this requires additional effort though, with Cypress it comes out of the box. Last but not least, with Cypress you can test Electron applications. Electron is a framework which enables you to write desktop applications in HTML, CSS, and JavaScript. Those applications are run within Electron browser, which is based on Chromium and Node.js. A good example of an Electron application is Postman (check Introduction to Postman with examples post). Cypress Test Runner is also an Electron application. And Cypress uses Cypress to test Cypress (Test Runner). Testing of Electron applications is not really a straight-forward task. It requires some amount of functions stubbing.

Conclusion

Cypress is a really great tool. It provides very good features to enable you to create integration tests. I have used Selenium way too much in order to dislike it. Tests with it are slow and flaky. I really hope there is something better out there. On the other hand, I have used Cypress way too little to like it very much and think this is the tool. In any way do try Cypress. If you do not like it, then definitely introduce it to your developers.
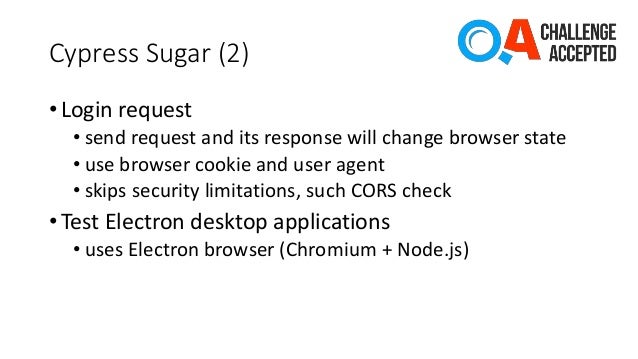
Related Posts

Read more...

Soft assertions for C# unit testing frameworks (MSTest, NUnit, xUnit.net)

Last Updated on by

Post summary: Code example of very easy and useful custom implementation of soft assertions in C# unit testing frameworks such as MSTest, NUnit or xUnit.net.

The code shown in examples below is available in GitHub DotNetSamples/SoftAssertions repository.

Unit vs Functional testing

Unit testing paradigm states that each test exercises particular code behavior. So in a perfect world, one unit test would have one assertion which defines unit test result – either passed or failed. This is why unit testing frameworks provide only asserts which stop further execution of current test method. In functional testing usually, one test verifies several conditions. Not debating if this is good or bad. Assume you are doing GUI testing, once you have opened particular page you’d better do as much verification as possible to reduce the risk of bugs. Having this page opened over and over for every single check is not the most efficient way of testing. This is why when you run functional tests you need some kind of assert that indicates whether passed or failed but to let the test continue in no critical issue is present. Those are generally called “soft” asserts.

Soft assertions code

Following code is an implementation of soft assertions:

using System.Collections.Generic;
using System.Linq;
using FluentAssertions;

public class SoftAssertions
{
	private readonly List<SingleAssert> 
		_verifications = new List<SingleAssert>();

	public void Add(string message, string expected, string actual)
	{
		_verifications.Add(new SingleAssert(message, expected, actual));
	}

	public void Add(string message, bool expected, bool actual)
	{
		Add(message, expected.ToString(), actual.ToString());
	}

	public void Add(string message, int expected, int actual)
	{
		Add(message, expected.ToString(), actual.ToString());
	}

	public void AddTrue(string message, bool actual)
	{
		_verifications
			.Add(new SingleAssert(message, true.ToString(), actual.ToString()));
	}

	public void AssertAll()
	{
		var failed = _verifications.Where(v => v.Failed).ToList();
		failed.Should().BeEmpty();
	}

	private class SingleAssert
	{
		private readonly string _message;
		private readonly string _expected;
		private readonly string _actual;

		public bool Failed { get; }

		public SingleAssert(string message, string expected, string actual)
		{
			_message = message;
			_expected = expected;
			_actual = actual;

			Failed = _expected != _actual;
			if (Failed)
			{
				// TODO Act in case of failure, e.g. take screenshot
				var screenshot = "MethodToSaveScreenshotAndReturnFilename";
				_message += $". Screenshot captured at: {screenshot}";
			}
		}

		public override string ToString()
		{
			return $"'{_message}' assert was expected to be " +
					$"'{_expected}' but was '{_actual}'";
		}
	}
}

Soft assertions details

The actual assertion is handled by SingleAssert class. It contains a message to be displayed to the user in case of failing test as well as expected and actual values. It is possible to extend the SingleAssert class so in case of failure you can do some specific actions, such as taking a screenshot. They are stored as strings. All asserts during testing are stored in a List<SingleAssert>. There are several methods that add assert. There are such that accept bool, string, and int. You can extend and add as many as you want. It is mandatory to call AssertAll() method so asserts can be evaluated. The evaluation consists of filtering out passed asserts leaving only failed: var failed = _verifications.Where(v => v.Failed).ToList(). Then list with failed is checked for empty failed.Should().BeEmpty(). In this case, FluentAssertions framework is used, but the code can be changed to such that suits your particular needs.

Soft assertions usage

Usage is pretty straightforward. SoftAssertions object should be created before each test and asserted after each test:


[TestClass]
public class UnitTest
{
	private SoftAssertions _softAssertions;

	[TestInitialize]
	public void SetUp()
	{
		_softAssertions = new SoftAssertions();
	}

	[TestCleanup]
	public void TearDown()
	{
		_softAssertions.AssertAll();
	}

	[TestMethod]
	public void TestMixedSoftAssertions()
	{
		_softAssertions.Add("Passing bool Add assertion", true, true);
		_softAssertions.Add("Failing bool Add assertion", true, false);
		_softAssertions
			.Add("Passing string Add assertion", "SameString", "SameString");
		_softAssertions
			.Add("Failing string Add assertion", "SameString", "OtherString");
		_softAssertions.Add("Passing int Add assertion", 1, 1);
		_softAssertions.Add("Failing int Add assertion", 1, 2);
		_softAssertions.AddTrue("Passing AddTrue assertion", true);
		_softAssertions.AddTrue("Failing AddTrue assertion", false);
	}
}

Soft assertions result

Result of test shown above is: Result Message: Expected collection to be empty, but found {‘Failing bool Add assertion’ assert was expected to be ‘True’ but was ‘False’, ‘Failing string Add assertion’ assert was expected to be ‘SameString’ but was ‘DifferentString’, ‘Failing int Add assertion’ assert was expected to be ‘1’ but was ‘2’, ‘Failing AddTrue assertion’ assert was expected to be ‘True’ but was ‘False’}.

This comes out of the box because FluentAssertions is used. Otherwise, you have to do some other output and assertions.

Other soft assertions

Some custom implementation of soft assertions is as well available in NTestRunner framework, but it is more complex and demanding special approach for writing tests.

Conclusion

Soft assertions are very useful in functional testing. With this simple class, you can directly have them in your functional tests.

Related Posts

Read more...

Soft assertions that do not fail JUnit test

Last Updated on by

Post summary: Code examples how to use assertions that do not fail the unit test immediately.

The code shown in examples below is available in GitHub java-samples/jersey1 repository.

Unit vs Functional testing

Unit testing paradigm states that each test exercises particular code behavior. So in a perfect world, one unit test would have one assertion which defines unit test result – either passed or failed. This is why unit testing frameworks provide only asserts which stop further execution of current test method. In functional testing usually, one test verifies several conditions. Not debating if this is good or bad. Assume you are doing GUI testing, once you have opened particular page you’d better do as much verification as possible to reduce the risk of bugs. Having this page opened over and over for every single check is not the most efficient way of testing. This is why when you run functional tests you need some kind of assert that indicates whether passed or failed but to let the test continue in no critical issue is present. Those are generally called “soft” asserts.

Soft assertions and JUnit

TestNG provides org.testng.asserts.SoftAssert class for soft asserts as it is more oriented towards functional testing. JUnit is a unit testing framework, so it does not provide any soft assertions. In order to create such behavior, additional libraries are needed.

AssertJ

AssertJ is a library providing fluent assertions. It is very similar to Hamcrest which comes by default with JUnit. Along with all the asserts, AssertJ provides soft assertions with its SoftAssertions class inside org.assertj.core.api package.

Usage

Below is a functional test run against Dropwizard stub described in Build a RESTful stub server with Dropwizard post. Important is to instantiate a new SoftAssertions object before the test verifications and to call assertAll() method in the end to collect results. Best way to do this is to use JUnit’s @Before and @After annotated methods.

package com.automationrhapsody.jersey1;

import com.automationrhapsody.jersey1.model.Person;
import com.automationrhapsody.jersey1.rules.PersonServiceJerseyClient;

import java.util.List;

import org.assertj.core.api.SoftAssertions;
import org.junit.After;
import org.junit.Before;
import org.junit.ClassRule;
import org.junit.Test;

import static org.hamcrest.MatcherAssert.assertThat;
import static org.hamcrest.core.Is.is;

public class PersonServiceTest {

	@ClassRule
	public static final PersonServiceJerseyClient CLIENT 
		= new PersonServiceJerseyClient();

	private SoftAssertions softAssertions;

	private Person person;

	@Before
	public void setUp() {
		person = new Person();
		person.setId(123);
		person.setFirstName("First Name");
		person.setLastName("Last Name");
		person.setEmail("Email");

		softAssertions = new SoftAssertions();
	}

	@After
	public void tearDown() {
		softAssertions.assertAll();
	}

	@Test
	public void testAllOperations() {
		String saveResult = CLIENT.save(person);
		assertThat(saveResult, is("Added Person with id=123"));

		Person actual = CLIENT.get(person.getId());
		softAssertions
			.assertThat(actual.getId()).isEqualTo(person.getId());
		softAssertions
			.assertThat(actual.getFirstName()).isEqualTo(person.getFirstName());
		softAssertions
			.assertThat(actual.getLastName()).isEqualTo(person.getLastName());
		softAssertions
			.assertThat(actual.getEmail()).isEqualTo(person.getEmail());

		String result = CLIENT.remove();
		assertThat(result, is("Last person remove. Total count: 4"));
	}
}

Conclusion

Soft assertions are needed in case of functional tests being run with JUnit. Since such is not available out of the box because JUnit is targeted for unit tests soft assertions can be used from external libraries such as AssertJ.

Related Posts

Read more...

Manage and automatically select needed WebDriver in Java 8 Selenium project

Last Updated on by

Post summary: Example code how to efficiently manage and automatically select needed local WebDriver using Java 8 method reference used as lambda expression.

Code examples in the current post can be found in GitHub selenium-samples-java/design-patterns repository.

Java 8 features

In this example lambda expression and method reference, Java 8 features are used. More in Java 8 features can be found in Java 8 features – Lambda expressions, Interface changes, Stream API, DateTime API post.

Functional interface

Before explaining lambda it is needed to understand the idea of a functional interface as they are leveraged for use with lambda expressions. A functional interface is an interface that has only one abstract method that is to be implemented. A functional interface may or may not have default or static methods (again new Java 8 feature). Although not mandatory, a good practice is to annotate the functional interface with @FunctionalInterface.

Lambda expressions

There is no such term in Java, but you can think of lambda expression as an anonymous method. Lambda expression is a piece of code that provides an inline implementation of a functional interface, eliminating the need for using anonymous classes. Lambda expressions facilitate functional programming and ease development by reducing the amount of code needed.

Method reference

Sometimes when using lambda expression all you do is call a method by name. Method reference provides an easy way to call the method making the code more readable.

Managing WebDriver

The proposed solution of managing WebDriver has enumeration called Browser and class called WebDriverFactory. Another important thing is web drivers should be placed in a folder with name webdrivers and named with a special pattern.

Browser enum

The code is shown below:

package com.automationrhapsody.designpatterns;

import java.util.Arrays;
import java.util.function.Supplier;

import org.openqa.selenium.WebDriver;
import org.openqa.selenium.chrome.ChromeDriver;
import org.openqa.selenium.firefox.FirefoxDriver;
import org.openqa.selenium.ie.InternetExplorerDriver;

public enum Browser {
	FIREFOX("gecko", FirefoxDriver::new),
	CHROME("chrome", ChromeDriver::new),
	IE("ie", InternetExplorerDriver::new);

	private String name;
	private Supplier<WebDriver> driverSupplier;

	Browser(String name, Supplier<WebDriver> driverSupplier) {
		this.name = name;
		this.driverSupplier = driverSupplier;
	}

	public String getName() {
		return name;
	}

	public WebDriver getDriver() {
		return driverSupplier.get();
	}

	public static Browser fromString(String value) {
		for (Browser browser : values()) {
			if (value != null && value.toLowerCase().equals(browser.getName())) {
				return browser;
			}
		}
		System.out.println("Invalid driver name passed as 'browser' property. "
			+ "One of: " + Arrays.toString(values()) + " is expected.");
		return FIREFOX;
	}
}

Enumeration’s constructor has Supplier functional interface as a parameter. When the constructor is called method reference FirefoxDriver::new is called as a lambda expression which purpose is to instantiate new Firefox driver. If only lambda expression is used is would be: () -> new FirefoxDriver(). Notice that method reference is much shorter and easy to read. getDriver() method invokes Supplier’s get() method which is implemented by the lambda expression, so lambda expression is executed hence instantiating new web driver. With this approach Firefox web driver object is created only when getDriver() method is called.

WebDriverFactory

Code is:

package com.automationrhapsody.designpatterns;

import java.io.File;

import org.openqa.selenium.WebDriver;

class WebDriverFactory {

	private static final String WEB_DRIVER_FOLDER = "webdrivers";

		public static WebDriver createWebDriver() {
		Browser browser = Browser.fromString(System.getProperty("browser"));
		String arch = System.getProperty("os.arch").contains("64") ? "64" : "32";
		String os = System.getProperty("os.name").toLowerCase().contains("win") 
				? "win.exe" : "linux";
		String driverFileName = browser.getName() + "driver-" + arch + "-" + os;
		String driverFilePath = driversFolder(new File("").getAbsolutePath());
		System.setProperty("webdriver." + browser.getName() + ".driver", 
				driverFilePath + driverFileName);
		return browser.getDriver();
	}

	private static String driversFolder(String path) {
		File file = new File(path);
		for (String item : file.list()) {
			if (WEB_DRIVER_FOLDER.equals(item)) {
				return file.getAbsolutePath() + "/" + WEB_DRIVER_FOLDER + "/";
			}
		}
		return driversFolder(file.getParent());
	}
}

This code recursively searches for a folder named webdrivers in the project. This is done because when you have a multi-module project running from IDE and from Maven has different root folder and finding web drivers is not possible from both simultaneously. Once the folder is found then proper web driver is selected based on OS and architecture. The code reads browser system property which can be passed from outside hence making the selection of web driver easy to configure. The important part is to have web drivers with special naming convention.

Web drivers naming convention

In order code above to work the web drivers should be placed in webdrivers folder in the project and their names should match the pattern: {DIVER_NAME}-{ARCHITECTURE}-{OS}, e.g. geckodriver-64-win.exe for Windows 64 bit and geckodriver-64-linux for Linux 64 bit.

Conclusion

The proposed solution is a very elegant way to manage your web drivers and select proper one just by passing -Dbrowser={BROWSER} Java system property.

Related Posts

Read more...

Retry JUnit failed tests immediately

Last Updated on by

Post summary: How to retry failed JUnit tests immediately and if a retry is OK then report test as passed.

Approaches

There are mainly three approaches to make JUnit retry failed tests.

  • Maven Surefire or Failsafe plugins – follow plugin name links for more details how to use and configure plugins
  • JUnit rules – code listed in the current post can be used as a rule. See more for rules in Use JUnit rules to debug failed API tests post. Problem is @Rule annotation works for test methods only. In order to have retry logic in @BeforeClass then the @ClassRule object should be instantiated.
  • JUnit custom runner – this post is dedicated to creating own JUnit retry runner and run tests with it.

Custom JUnit retry runner

A custom runner can be created by extending org.junit.runners.BlockJUnit4ClassRunner class and override public void run(final RunNotifier notifier) and protected void runChild(final FrameworkMethod method, RunNotifier notifier) methods. run() is accessed when test class is instantiated, runChild() is accessed when test method is run. Below is the code for custom JUnit retry runner class:

package com.automationrhapsody.junit.runners;

import org.junit.Ignore;
import org.junit.internal.AssumptionViolatedException;
import org.junit.internal.runners.model.EachTestNotifier;
import org.junit.runner.Description;
import org.junit.runner.notification.RunNotifier;
import org.junit.runner.notification.StoppedByUserException;
import org.junit.runners.BlockJUnit4ClassRunner;
import org.junit.runners.model.FrameworkMethod;
import org.junit.runners.model.InitializationError;
import org.junit.runners.model.Statement;

public class RetryRunner extends BlockJUnit4ClassRunner {

	private static final int RETRY_COUNT = 2;

	public RetryRunner(Class<?> clazz) throws InitializationError {
		super(clazz);
	}

	@Override
	public void run(final RunNotifier notifier) {
		EachTestNotifier testNotifier = new EachTestNotifier(notifier, getDescription());
		Statement statement = classBlock(notifier);
		try {
			statement.evaluate();
		} catch (AssumptionViolatedException ave) {
			testNotifier.fireTestIgnored();
		} catch (StoppedByUserException sbue) {
			throw sbue;
		} catch (Throwable t) {
			System.out.println("Retry class: " + getDescription().getDisplayName());
			retry(testNotifier, statement, t, getDescription());
		}
	}

	@Override
	protected void runChild(final FrameworkMethod method, RunNotifier notifier) {
		Description description = describeChild(method);
		if (method.getAnnotation(Ignore.class) != null) {
			notifier.fireTestIgnored(description);
		} else {
			runTest(methodBlock(method), description, notifier);
		}
	}

	private void runTest(Statement statement, Description description, RunNotifier notifier) {
		EachTestNotifier eachNotifier = new EachTestNotifier(notifier, description);
		eachNotifier.fireTestStarted();
		try {
			statement.evaluate();
		} catch (AssumptionViolatedException e) {
			eachNotifier.addFailedAssumption(e);
		} catch (Throwable e) {
			System.out.println("Retry test: " + description.getDisplayName());
			retry(eachNotifier, statement, e, description);
		} finally {
			eachNotifier.fireTestFinished();
		}
	}

	private void retry(EachTestNotifier notifier, Statement statement, Throwable currentThrowable, Description info) {
		int failedAttempts = 0;
		Throwable caughtThrowable = currentThrowable;
		while (RETRY_COUNT > failedAttempts) {
			try {
				System.out.println("Retry attempt " + (failedAttempts + 1) + " for " + info.getDisplayName());
				statement.evaluate();
				return;
			} catch (Throwable t) {
				failedAttempts++;
				caughtThrowable = t;
			}
		}
		notifier.addFailure(caughtThrowable);
	}
}

The code shown above is available in GitHub java-samples/junit repository.

Using JUnit RetryRunner

In order to configure JUnit test to use the runner, class holding tests should be annotated with @RunWith:

@RunWith(RetryRunner.class)
public class RetryRunnerTests {
	@Test
	public void testRetrySuccessFirstTime() {
		assertTrue(true);
	}
}

Conclusion

Making JUnit to rerun is easy, the harder thing to do is to fix your tests so they pass from the first time. Generally, it is not good to have tests that are flaky.

Read more...

Complete guide to email verifications with Automation SMTP Server

Last Updated on by

Post summary: How to do complete email verification with your own Automation SMTP server.

SMTP is protocol initially defined in 1982 and is still used nowadays. In order to automate application which sends out emails, you need SMTP server which reads messages and saves them to disk for further processing. Note that this is only in the case when your application sends emails.

Windows SMTP server

One option is to use SMTP server provided by Windows. Problems here are two. First is that from Vista SMTP server is no more supported. There is SMTP server in Windows Server distributions but the license for them is more expensive. The second problem comes from the configuration of the server. You might have several machines and configurations should be maintained on all of them. It is a feasible option to use Windows SMTP server but the current post is not dedicated to it.

Automation SMTP Server

What I offer in this post is your own Automation SMTP Server. It is located in following GitHub project. The solution is actually a mixture of two open source projects. For the server, I use Antix SMTP Server For Developers, which is really good SMTP server. It is windows application and is more suitable for manual SMTP testing rather than automation. I’ve extracted the SMTP core with some modifications as a console application which saves emails as EML file on disk. For the reading of emails, I use the source code of Easily Retrieve Email Information from .EML Files article with several modifications. What you need to do in order to make successful email verification is download executable from GitHub and follow instructions below. More info for it can be found on its homepage Automation SMTP Server.

Automation SMTP Server usage

In GitHub AutomationSMTPServer repository there is an example that shows how to use Automation SMTP Server. The server should be added as a reference to your automation project. Since it is a reference it gets copied into compiled executables folder.

Delete recent emails

Before doing anything in your tests it is good to delete old emails. Automation SMTP Server is saving mail into a folder named “temp”. This is how it works and cannot be changed.

private string currentDir =
	Directory.GetCurrentDirectory() + Path.DirectorySeparatorChar;
private string mailsDir = currentDir + "temp";

if (Directory.Exists(mailsDir))
{
	Directory.Delete(mailsDir, true);
}

Start Automation SMTP Server

The server is a console application. It receives emails and saves them to disk. If counterparty sends a QUIT message to disconnect server gets restarted to wait for next connection. The server should be started as a process. Port should be provided as arguments. If not provided it can be configured in SMTP Server config file. If not configured there it gives a message and takes 25 for default port.

Process smtpServer = new Process();
smtpServer.StartInfo.FileName = currentDir + "AutomationSMTPServer.exe";
smtpServer.StartInfo.Arguments = "25";
smtpServer.Start();

Send emails

This is the point where your application under test is sending emails which you will later verify.

Read emails

Once emails have been sent out from the application under test you are ready to read and process them.

string[] files = Directory.GetFiles(mailsDir);
List<EMLFile> mails = new List<EMLFile>();

foreach (string file in files)
{
	EMLFile mail = new EMLFile(file);
	mails.Add(mail);
	File.Delete(file);
}

Verify emails

Here you can use EMLFile class which is parsing the EML file and is representing is an object so you can do operations on it. Once you have the mail as an object you can access all its attributes and verify some of them. It all depends on your testing strategy. Another option is to define on expected EML file, read it and compare both actual and expected. EMLFile class has predefined Equals method which is comparing all the attributes of the emails.

bool compare1 = mails[0].Equals(mails[1]);
bool compare2 = mails[0].Equals(mails[2]);
bool compare3 = mails[1].Equals(mails[2]);

Stop Automation SMTP Server

This part is important. If not stopped server will continue to work and will block the port. Its architecture is defined in such manner that only way to stop it is it to terminate console application. In a case where you have started it from C# code as process way to stop it is to kill the process.

smtpServer.Kill();

Conclusion

Proper email verification can be a challenge. In case your application under tests send emails I would say it is crucial to have correct email testing as mail is what customers receive. And in the end, it is all about customers! So give it a try and enjoy this easy way of email verification.

Read more...

Extract and verify text from PDF with C#

Last Updated on by

Post summary: How to extract text from PDF in C#.

PDF verification is pretty rare case in automation testing. Still it could happen.

iTextSharp

iTextSharp is a library that allows you to manipulate PDF files. We need very small of this library. It has build in reader that iterates through pages and returns only text.

using iTextSharp.text.pdf;
using iTextSharp.text.pdf.parser;
using System.Text;

namespace PDFExtractor
{
	public class PDFExtractor
	{
		public static string ExtractTextFromPDF(string pdfFileName)
		{
			StringBuilder result = new StringBuilder();
			// Create a reader for the given PDF file
			using (PdfReader reader = new PdfReader(pdfFileName))
			{
				// Read pages
				for (int page = 1; page <= reader.NumberOfPages; page++)
				{
					SimpleTextExtractionStrategy strategy =
						new SimpleTextExtractionStrategy();
					string pageText =
						PdfTextExtractor.GetTextFromPage(reader, page, strategy);
					result.Append(pageText);
				}
			}
			return result.ToString();
		}
	}
}

Verification

Once extracted text can be verified against expected as described in Text verification post.

Related Posts

Read more...

Text verification

Last Updated on by

Post summary: Verify actual text with expected one by ignoring what is not relevant during compare.

In automation testing, there is no definitive way what text verification is best to be done. One strategy is to check that an expected word or a phrase exists in actual text shown in the application under test. Another strategy is to prepare a large amount of text to verify. Later strategy is expensive in case of effort for preparation and maintenance. The first strategy might not be sufficient to do correct verifications.

In between

What I suggest here is something in between. Not too much but not too less. Problem with a paragraph of text to be verified is it might contain data we do not have control over, e.g. date, time, unique values, etc.

Example

Imagine an e-commerce website. When you place the order there is order confirmation page. You want to verify not only that you are on this page but also that text is correct as per specification. Most likely text will contain data you do not have control over – order number and date. Breaking verification is small chunks is an option. Another option is to manipulate the actual text. The third option is to define the text as expected with special strings that will get ignored during compare.

Actual vs Expected

Actual text could be: “Order 123456 has been successfully placed on 01.01.1970! Thank you for your order. ”
The expected text could be: “Order ~SKIP~ has been successfully placed on ~SKIP~! Thank you for your order. ”
And then you can compare both where ~SKIP~ will be ignored during compare.

Compare code

Code to do the compare shown above is incorporated in NTestsRunner also:

public const string IgnoreDuringCompare = "~SKIP~";

public static bool EqualsWithIgnore(this string value1, string value2)
{
	string regexPattern = "(.*?)";
	// If value is null set it to empty
	value1 = value1 ?? string.Empty;
	value2 = value2 ?? string.Empty;
	string input = string.Empty;
	string pattern = string.Empty;
	// Unify new lines symbols
	value1 = value1.Replace("\r\n", "\n");
	value2 = value2.Replace("\r\n", "\n");
	// If no one conains ignore string then compare directly
	if (!value1.Contains(IgnoreDuringCompare) &&
		!value2.Contains(IgnoreDuringCompare))
	{
		return value1.Equals(value2);
	}
	else if (value1.Contains(IgnoreDuringCompare))
	{
		pattern = Regex.Escape(value1).Replace(IgnoreDuringCompare, regexPattern);
		input = value2;
	}
	else if (value2.Contains(IgnoreDuringCompare))
	{
		pattern = Regex.Escape(value2).Replace(IgnoreDuringCompare, regexPattern);
		input = value1;
	}

	Match match = Regex.Match(input, pattern);
	return match.Success;
}

Use in tests

In your tests you will do something like:

string actual = OrderConfirmationPage.GetConfirmationText();
string expected = "Order " + ExtensionMethods.IgnoreDuringCompare +
	" has been successfully placed on " + ExtensionMethods.IgnoreDuringCompare +
	"! Thank you for your order. ";
Assert.IsTrue(actual.EqualsWithIgnore(expected));

Conclusion

It might take little bit more effort to prepare expected strings but verification will be more accurate and correct rather than just to expect a word or a phrase.

Related Posts

Read more...

Multilingual automation testing with enumerations

Last Updated on by

Post summary: Solution for automated testing of multilingual sites by using string values in all supported languages for enumerations.

In efficiently use of enumerations with string values in C# post I’ve described how you can add text to an enumeration element and then use it. Current post is elaboration with code samples for testing multilingual applications.

The challenge

Multilingual automation is always a challenge. If you use text to locate elements or verify condition then trying to run a test with different language will fail. Enumerations with language dependent string values is a pretty good solution. How to do it is described below.

Define attribute

StringValue class is extending System.Attribute. It has two properties for text and language. It should have AllowMultiple = true in order to be applied as many times as many languages you have.

namespace System
{
	[AttributeUsage(AttributeTargets.Field, AllowMultiple = true)]
	public class StringValue : Attribute
	{
		public string Value { get; private set; }
		public string Lang { get; private set; }

		public StringValue(string lang, string value)
		{
			Lang = lang;
			Value = value;
		}
	}
}

Read attribute

With reflection read all StringValue attributes. Iterate them and return the one that matches language given as parameter.

using System.Reflection;

namespace System
{
	public static class ExtensionMethods
	{
		public static string GetStringValue(this Enum value, string lang)
		{
			string stringValue = value.ToString();
			Type type = value.GetType();
			FieldInfo fieldInfo = type.GetField(value.ToString());
			StringValue[] attrs = fieldInfo.
				GetCustomAttributes(typeof(StringValue), false) as StringValue[];
			foreach (StringValue attr in attrs)
			{
				if (attr.Lang == lang)
				{
					return attr.Value;
				}
			}
			return stringValue;
		}
	}
}

Apply to enumerations

All supported languages can be defined as string constants. It will be pretty cool if can define an enumeration with languages and pass it in the StringValue constructor as a language but it is not possible as it is not a compile-time constant.

public class Constants
{
	public const string LangEn = "en";
	public const string LangFr = "fr";
	public const string LangDe = "de";
}

public enum Messages
{
	[StringValue(Constants.LangEn, "Problem occured, try again later")]
	[StringValue(Constants.LangFr, "Problème survenu, réessayer plus tard")]
	[StringValue(Constants.LangDe, "Problem aufgetreten, " +
		"versuchen Sie es später erneut")]
	ProblemOccured,
	[StringValue(Constants.LangEn, "Successfully done")]
	[StringValue(Constants.LangFr, "Fait avec succès")]
	[StringValue(Constants.LangDe, "Erfolgreich durchgeführt")]
	Success
}

Use in code

Somewhere at a top level of your tests, you should have property or field which most likely will be read from conflagration and will define for which locale is the current test run.

string lang = Constants.LangFr;

This is then used to read correct text value for given enumeration element.

Assert.AreEqual(Messages.ProblemOccured.GetStringValue(lang), 
	App.MessageBox.GetText());

Conclusion

Multilingual testing is a challenge. Be smart and use all tricks you might get. In this post, I’ve revealed pretty good trick to do the automation. Challenge with this approach will be initially set up of enumerations with all the translations.

Related Posts

Read more...

Efficiently use of enumerations with string values in C#

Last Updated on by

Post summary: Using enumerations or specialized classes makes your automation tests easy to understand and maintain. Show with code samples how to define and read string value to enumeration elements.

When you do automation tests and have to pass a value to a method it is so easy and natural to just use strings. There are many cases where a string is a correct solution. There are also many cases where a string can be a solution, but enumeration or specialized class are better and more efficient solution.

Why not strings

Having the following example – web application with drop down which has several options. We are using Page objects pattern to model the page. Page object has a method which accepts the option to be selected. String seems like a natural solution but is wrong. Although string will work enumeration is the only right solution. Drop down has limited and already defined options that can be selected. Exposing just string may cause misinterpretations for the consumer of your method. It is much more easy to limit the consumer to several enumeration values. In this way, consumer knows what data to provide and this automatically keeps code clean from magic strings. If changes are needed they will be done only in the enumeration making code easier to maintain.

Problem with enumerations in C#

Using enumerations for example given above will not work. Unlike Java enumerations in C# are wrappers for int or other numeric types value. You are not able to use text with enumeration element.

Using string values with enumerations

Only way to use string values in enumerations is by adding it as an attribute to each enumeration’s element. It takes several steps in order to accomplish this.

  1. Create the attribute class that will be applied to enumeration element
  2. Create extension method that is responsible for reading a string value from enumeration element
  3. Apply string value attribute to enumeration element
  4. Use in code

Below are code samples how to use string values with enumerations in C#. Defining and reading of the attribute is functionality built in NTestsRunner.

Define attribute

The first step is to create a class that extends System. Attribute. It has only one string property to hold the text in it. The text is passed in the constructor. Note that this class is defined in System namespace in order to have it by default skipping the need of importing namespace you might not be aware of.

namespace System
{
	public class StringValue : Attribute
	{
		public string Value { get; private set; }

		public StringValue(string value)
		{
			Value = value;
		}
	}
}

Read the attribute

C# provides so-called extension methods, a great way to add new functionality to the existing type without creating new derived type. Reading of string value from enumeration element is done with a GetStringValue extension method. With reflection, all StringValue custom attributes of an element are obtained. If some found text of first is returned. If not then string representation of the element is returned.

using System.Reflection;

namespace System
{
	public static class ExtensionMethods
	{
		public static string GetStringValue(this Enum value)
		{
			string stringValue = value.ToString();
			Type type = value.GetType();
			FieldInfo fieldInfo = type.GetField(value.ToString());
			StringValue[] attrs = fieldInfo.
				GetCustomAttributes(typeof(StringValue), false) as StringValue[];
			if (attrs.Length > 0)
			{
				stringValue = attrs[0].Value;
			}
			return stringValue;
		}
	}
}

Apply to enumerations

Once StringValue class is ready it can be applied as an attribute to any enumeration.

public enum Messages
{
	[StringValue("Problem occured, try again later")]
	ProblemOccured,
	[StringValue("Successfully done")]
	Success
}

Use in code

In code string value can be obtained from enumeration’s element with a GetStringValue method.

Assert.AreEqual(Messages.ProblemOccured.GetStringValue(), App.MessageBox.GetText());

Conclusion

Using enumerations is mandatory to make readable and maintainable automation. Working effectively with enumerations will increase your value as automation specialist.

Related Posts

Read more...

NTestsRunner for functional automated tests

Last Updated on by

Post summary: NTestsRunner implementation details and features.

In the previous post I’ve described unit testing frameworks and why they are not suitable for running functional automated tests. I introduced NTestsRunner – very simple runner that can be used for running your automation tests. This topic is dedicated to implementation details of the NTestsRunner.

Verifications

It is important in functional testing to be able to place several verification points in one test. For this purpose, abstract class Verification is implemented. It has two properties to store more details about verification and time it was taken. Constructor receives comma separated string values. In case of zero strings are passed then the result is an empty string. If one string is passed then this is the result. If more than one string is added then first string is taken as formatting string and others are used to build up the result. Logic is similar to string.Format(String, Object[]) method.

public abstract class Verification
{
	public string Result { get; private set; }
	public DateTime ExecutedAt { get; private set; }

	public Verification(params object[] args)
	{
		...
	}
}

Passed or Failed

In automation test may have two conditions – passed or failed. This is why two concrete classes are extending Verification: VerificationPassed and VerificationFailed. They do not add any other functionality. Those classes use parent’s class constructor. This is an example how to instantiate an object from those classes:

string value = "number";
int number = 1;
Verification result =
	new VerificationFailed("This is formatting string {0} {1}. ",
		value,
		number);

Test case result

Test case is generally a set of conditions to verify whether given scenario works are per user requirements. In automation, world test case is test method with several verification points inside. In NTestsRunner TestCaseResult is class representing the idea of a test case. It has properties for name, time to run and list of all verifications with a count of passed and failed.

public class TestCaseResult
{
	public List<Verification> Verifications = new List<Verification>();
	public string Name { get; set; }
	public int VerificationsFailed { get; set; }
	public int VerificationsPassed { get; set; }
	public TimeSpan Time { get; set; }
}

Test plan result

TestPlanResult in NTestsRunner has nothing to do with test plan term from QA world. Here this is a representation of a test class with test methods inside. It has properties for name and time to run. Also, there is a list of all TestCaseResults, i.e. test methods in that class. There are counters for passed and failed test cases and also counters for all passed and failed verifications inside all TestCaseResults.

public class TestPlanResult
{
	public List<TestCaseResult> TestCases = new List<TestCaseResult>();
	public string Name { get; set; }
	public int TestCasesPassed { get; private set; }
	public int TestCasesFailed { get; private set; }
	public int VerificationsPassed { get; private set; }
	public int VerificationsFailed { get; private set; }
	public TimeSpan Time { get; private set; }

	public void Count()
	{
		...
	}
}

Class and method attributes

In order to make one class a test class, it should have with [TestClass] attributes. To convert method to a test one it should have [TestMethod] attribute. Just the attribute is not enough though. The method should have special method signature. This is required by NTestsRunner.

Test method signature

In order to run without exception test method needs to conform to two rules:

  1. To have attribute [TestMethod]
  2. Method to receive parameter List verifications in its signature, i.e.
    [TestMethod]
    public void TestMethod1(List<Verification> verifications)
    

Configurations

Configurations can be found on NTestRunner home page.

Execution

Once object from NTestsRunner is instantiated and configured tests with Execute() method. Inside this method, all classes from calling assembly (the one that holds the tests) are taken. If TestsToExecute is configured then only those with name matching is given values are taken. If no TestsToExecute is provided then all classes with the attribute [TestClass] are taken. Methods from each class are taken by default in order of appearance in the class. If the method has [TestClass] attribute then the method is executed by passing List object to it. Inside the method, Verifications are collected as a list into a TestCaseResult object. After the method is run TestCaseResult is added to its parent TestPlanResult which is added to list with all results. In the end, results are saved as XML and HTML.

Results in JUnit XML

In order to integrate with CI tools such as Jenkins or Bamboo results are exported to XML file after execution has finished. The file is named Results.xml and is located in test results folder. XML format is implemented according to junit-4.xsd.

Results in HTML

Tests result are saved as HTML report for better readability. The file is named Results.html and is located in test results folder.

Usage

In order to use NTestsRunner a console application project is needed. This project will hold test classes. As the one below. Take into consideration that this is very simplified usage pattern. In reality, Page objects design pattern will be used. Page objects will make the verifications and return them.

[TestClass]
public class TestClass1
{
	[TestMethod]
	public void TestMethod1(List<Verification> verifications)
	{
		// Do some actions
		verifications.Add(new VerificationFailed("There is error"));
		// Do some actions
		verifications.Add(new VerificationPassed("Everythign is OK"));
	}
}

In its main method, a new instance of NTestsRunner is created. Configurations are done and test executions are started. It is that simple to use it.

class Program
{
	static void Main(string[] args)
	{
		NTestsRunnerSettings settings = new NTestsRunnerSettings();
		settings.TestResultsDir = @"C:\temp";
		settings.MaxTestCaseRuntimeMinutes = 2;
		settings.TestsToExecute.Add("TestClass1");
		settings.PreventScreenLock = true;

		NTestsRunner runner = new NTestsRunner(settings);
		runner.Execute();
	}
}

Pros and cons

NTestsRunner has its pros and cons.
Pros are:

  • Pretty easy to use
  • Open source and can be customized to your specific needs
  • Gives you ability to make several verifications in one test and in case of failure it doesn’t break current test method
  • Tests are stored in console application that can be easily run
  • Results are saved in JUnit XML for CI integration
  • Results are saved in HTML

Cons are:

  • Test methods should have a specific signature
  • It is not easy to migrate existing tests to a new format

Conclusions

This is a pretty good tool for running functional automated tests. It is very easy to use and is made especially for running functional automated tests. You can definitely give it a try.

Related Posts

Read more...