How to gather code coverage with Istanbul and Selenium and pitfalls to avoid

Last Updated on by

Post summary: Istanbul does not seem to be recoding code coverage correctly, it turned out that the tests do navigation by changing the URL, which resets the code coverage.

How to use Istanbul for code coverage of Cypress automated tests was explained in detail in Testing with Cypress – Custom logging of errors and JUnit results post.

Code coverage with Istanbul and Selenium

Recently I had to do it again, this time with Selenium. There are several approaches, which can be taken to measure code coverage with Selenium. Whichever approach is taken, the first step is to instrument the frontend. How to do it with React and create-react-app is described in Testing with Cypress – Code coverage with Istanbul post. Coverage is present in __coverage__ JS frontend variable.

Once the frontend is instrumented, it is important to collect the code coverage after the tests are run. This is where approaches differ. One option is to use istanbul-middleware. In this case, a Node.js backend has to be created and the tests should post the coverage results, taken from __coverage__ to the backend. I find this approach not convenient, so I took the easier one.

Once the test is finished, the code coverage data is collected and saved as a JSON file in a test results folder, then all the results are used to generate the report. I use C# and the code to do so is as simple as:

public void CollectCodeCoverage()
	{
		var data = ((IJavaScriptExecutor)_webDriver)
			.ExecuteScript("return window.__coverage__");
		if (data != null)
		{
			var jsonString = JsonConvert.SerializeObject(data);
			var fileName = $"{_testResultsFolder}/coverage_{DateTime.Now.Ticks}.json";
			File.WriteAllText(fileName, jsonString);
		}
	}

Generating code coverage report

The report is generated with the nyc cli tool. Once all the JSON files are copied into a folder with the name .nyc_output, the command to run the report is nyc report –reporter=html. Nyc can be installed as a global NPM package or can be added to the frontend project inside package.json.

The issues measuring the code coverage

The setup described above is clear and easy to achieve. Although when tests were run, they did not record coverage, which was supposed to be there. I have spent several days trying to figure out what the issue was. And finally, I was able to understand. In my tests, I use _webDriver.Navigate().GoToUrl(). This actually visits a new URL, basically invalidating all the coverage results gathered so far. Once the problem was identified, the solution was pretty simple – save the cove coverage every time before a new URL is about to get opened.

Conclusion

Istanbul is a very good tool to measure the code coverage for web automation tests. In the current post, I have described a pitfall, which should be avoided when using it.

Related Posts

Read more...

Testing with Cypress – Code coverage with Istanbul

Last Updated on by

Post summary: This article describes how to extract and process Istanbul code coverage, and generate HTML reports.

This post is part of a Cypress series, you can see all post from the series in Testing with Cypress – lessons learned in a complete framework. Examples code is located in cypress-testing-framework GitHub repository.

Code coverage instrumentation

In Testing with Cypress – Build a React application with Node.js backend is described how the application is instrumented to track code coverage. This is a very essential part, without it, measurement is not possible.

Code coverage capturing data

Capturing of code coverage results is done in cypress/support/core/cypress_code_coverage.js file. It is included in cypress/support/index.js file with import ‘./core/cypress_code_coverage’; statement. For each and every test suite separate file with coverage data is created. Depending on the application those files can get pretty big, and writing and reading them slows the tests. So code coverage is controlled with TEST_CODE_COVERAGE environment variable. By default, it is set to false. Once all tests are run and coverage data is saved then it has to be merged. Merging is invoked with yarn cypress:report command.

Code coverage report

An important prerequisite is to generate the code coverage report is to have nyc installed as a global NPM package. Since the paths in the container are not the same as the paths locally, in order to read correct sources there is reprocessing of the paths, DOCKER_CONTAINER_PATH is replaced with the current folder. You can see how code coverage looks like in Istanbul-report. For this particular example only save_person_spec.js has been run with yarn cypress:run –spec=’cypress/tests/persons/save_person_spec.js’ command.

Conclusion

Code coverage is not a crucial part of the whole QA process but is very nice to have feature. With code coverage, we can improve on our tests, make them cover bits of the code that we have missed during analysis and creating of the tests themselves.

Related Posts

Read more...

Testing with Cypress – Build a React application with Node.js backend

Last Updated on by

Post summary: Short introduction to the application under test that is created for and used in all Cypress examples. It is React frontend created with Create React App package. Backend is a Node.js application running on Express.

This post is part of a Cypress series, you can see all post from the series in Testing with Cypress – lessons learned in a complete framework. Examples code is located in cypress-testing-framework GitHub repository.

Backend

The backend is a simple Node.js application build with Express web server. It supports several APIs that can save a person, get a person by id, get all persons or delete the last person in the collection. You can read the full description in Build a REST API with Express on Node.js and run it on Docker post.

Frontend

Current post is mainly devoted to the frontend. It described how the React application is built. In order to make this part easy, Create React App is used. The best thing about it is that you do not need to handle lots of configurations and you just focus on your application. In order to create an application, Create React App has to be installed as a global NPM package with npm install -g create-react-app. The application itself is created with create-react-app my-application-name. Once this is done you can start building your application. See more details on application creation in How to Create a React App with create-react-app. I have added Bootstrap for better styles and Toastr for nicer notifications. I also use Axios for API calls. I am not going into details about how to work with React as this is a pretty huge topic and I am not really expert at it. You can inspect the GitHub repository given above of how controllers are structured.

Instrumented for code coverage

After having the application ready I wanted to add support for code coverage. The tool used to measure code coverage is Istanbul. Because of Create React App, adding the configuration is not straight-forward as practically there is no webpack.config.js file, it is hidden.

One option is to eject the application. Maybe for a big project where you need full control over the configurations, this is OK, but for this small application, I would not want to deal with it.

Another option is to use a package that builds on top of Create React App. One such plugin is react-app-rewired. It is installed along with istanbul-instrumenter-loader, the actual code coverage plugin. Once those two are installed the actual configuration is pretty simple. A file named config-overrides.js is created with the following content:

const path = require('path');
const fs = require('fs');

module.exports = function override(config, env) {
  // do stuff with the webpack config...
  config.module.rules.push({
    test: /\.js$|\.jsx$/,
    enforce: 'post',
    use: {
      loader: 'istanbul-instrumenter-loader',
      options: {
        esModules: true
      }
    },
    include: path.resolve(fs.realpathSync(process.cwd()), 'src')
  });
  return config;
};

Also, package.json has to be changed. The default react-scripts start/build/test is changed to react-app-rewired start/build/test. In order to verify that code coverage is enabled, go to Dev Tools (hit keyboard F12), then go to Console and search for __coverage__ variable.

Dockerization

In order to make it easy to run a Dockerfile has been added. It installs Yarn as a package manager, then copies package.json. Important is to copy yarn.lock as well since the actual dependencies are in it. If this is not copied, every time an install is run it will pick the latest dependencies, which may lead to instability. Then the installation of dependencies is done with command yarn, short for yarn install. Finally, all local files are copied. This is done in the end so installation is not triggered on every file change, but only on package.json or yarn.lock change.

FROM node:8.16.0-alpine

ENV APP /app
WORKDIR $APP

RUN npm install yarn -g

COPY package.json $APP
COPY yarn.lock $APP
RUN yarn

COPY . .

The docker-compose.yml file is also very simple. It has two services. The first is the backend which is exposed to 9000 port of the host. This is needed because Cypress tests directly access the APIs. It uses the image uploaded to the Docker hub repository: image: llatinov/nodejs-rest-stub. The second service is the frontend. It uses local Dockerfile: build: .. When frontend container is started yarn start command is executed and is exposed to port 3030 of the host machine. One more thing, that is added as configuration, is the backend API URL that can be controlled by setting API_URL environment variable, which then is set to REACT_APP_API_URL, used by the frontend. If no API_URL is provided then the default of http://localhost:9000 is taken.

version: '3'

services:
  backend:
    image: llatinov/nodejs-rest-stub
    ports:
      - '9000:3000'
  frontend:
    build: .
    command: yarn start
    environment:
      - REACT_APP_API_URL=${API_URL:-http://localhost:9000}
    ports:
      - '3030:3000'

Run the application

There are several ways to run the application under test in order to try Cypress examples. One way is to download both repositories of the backend and the frontend and run them separately.

Second is to run the backend with Docker command docker run -p 9000:3000 llatinov/nodejs-rest-stub. The command maps the 3000 port of the container to 9000 port of the host, this is where the APIs are available. I have uploaded the backend image to the public Docker hub repository. After backend is running, the frontend is run with yarn start command. In this case, frontend is running on port 3000, so you have to adjust the proper URL in the Cypress configurations.

The third option is to run with docker-compose with docker-compose up command. This runs the backend on port 9000 and the frontend on port 3030.

Functionality

The application is very simple, it has few pages where user can add a person or see already existing persons in the backend. On each successful action, there is a notification, in case of a network error, a message is shown.

Persons list


Add person


Version page


Conclusion

In order to demonstrate the Cypress examples, a separate React application with a backend is created with Create React App package. It is also configured to support code coverage with Istanbul.

Related Posts

Read more...

Code coverage of Ruby on Rails application with simplecov

Last Updated on by

Post summary: How to measure code coverage of Ruby on Rails application with simplecov.

This is going to be a pretty short post. In general, it is very easy to measure code coverage on Ruby on Rails applications with a gem called simplecov.

Add coverage to Gemfile

gem 'simplecov', require: false

By using the require: false, Gem gets installed but it is not included when bundler is called. In order to use the Gem you manually have to call require ‘simplecov’.

Start code coverage

Starting the code coverage should be the first thing that the application is doing. So it can be invoked in config/boot.rb file. Add the following lines:

if ENV['ENABLE_CODE_COVERAGE']
    require 'simplecov'
    SimpleCov.start 'rails'
end

Do the testing

A small part in the current post, huge part in the actual effort. Run all the tests that you have, manual, automated, etc.

Gather code coverage

There are basically two ways to get the code coverage: shutdown the application or somehow call SimpleCov.result.format!. Not much to say on the first one. In many cases, it is more convenient to keep the application running, but only the coverage report. For the latter, you may have some controller which is available on for non-production environments, which you can hit with an HTTP call and it executed the code. The code coverage report is located in a folder called coverage in the root application folder.

Conclusion

It is pretty easy to measure code coverage on Ruby on Rails applications with the simplecov Gem.

Related Posts

Read more...

.NET Core code coverage on Linux with MiniCover

Last Updated on by

Post summary: How to run code coverage of your unit tests as part of your build on Linux build agents.

Code below can be found in GitHub SampleDotNetCore2RestStub repository. In Code coverage of .NET Core unit tests with OpenCover post, I have shown how to do code coverage with OpenCover. Commands shown in that post can be made part of your CI or CD build. There is a but though, this works only for windows. If you are having build machines on Linux you need another alternative. In this post, I’m going to show this alternative.

MiniCover

MiniCover is a lightweight code coverage tool for .NET Core on Linux. It is in an early stage yet and there is no big community, but I really hope this is going to change soon as it looks a very promising tool.

Include in project

In order to use MiniCover it has to be installed as .NET CLI Tool. This is done with following code:

<ItemGroup>
	<DotNetCliToolReference Include="MiniCover" Version="2.0.0-ci-*" />
</ItemGroup>

In order to keep your original projects intact, the best approach is to create tools project and add it to its tools.csproj file, which will look:

<Project Sdk="Microsoft.NET.Sdk">

  <PropertyGroup>
    <TargetFramework>netcoreapp2.0</TargetFramework>
  </PropertyGroup>

  <ItemGroup>
    <DotNetCliToolReference Include="MiniCover" Version="2.0.0-ci-*" />
  </ItemGroup>

</Project>

Commands

At this stage following command line options are available:

  • instrument – Instrument assemblies
  • uninstrument – Uninstrument assemblies
  • reset – Reset hits count
  • report – Outputs coverage report
  • htmlreport -Write HTML report to a folder
  • xmlreport – Write an NCover-formatted XML report to folder

Run coverage

In case of a project structure where you have your code in src folder and your tests in test folder following bash script can be used directly. It accepts as parameter threshold coverage percentage, if not provided it uses 80% by default. Script restores NuGet packages and builds the projects. It navigates to tools folder and restores NuGet packages again. This is very important as it is the only way to get MiniCover NuGet package. Inside tools folder, it instruments assemblies and resets previous statistics. Script navigates to root folder and runs all tests inside every project in test folder. Afterward, script navigates again to tools folder and uninstruments all assemblies so far. No matter this operation is safe I would recommend to run one more build or publish before assemblies go into production. In the end, the script generates reports.

if [ ! -z $1 ]; then
  if [ $1 -lt 0 ] || [ $1 -gt 100 ]; then
    echo "Threshold should be between 0 and 100"
    threshold=80
  fi
  threshold=$1
else
  threshold=80
fi

dotnet restore
dotnet build

cd tools
dotnet restore

# Instrument assemblies inside 'test' folder to detect hits for source files inside 'src' folder
dotnet minicover instrument --workdir ../ --assemblies test/**/bin/**/*.dll --sources src/**/*.cs 

# Reset hits count in case minicover was run for this project
dotnet minicover reset

cd ..

for project in test/**/*.csproj; do dotnet test --no-build $project; done

cd tools

# Uninstrument assemblies, it's important if you're going to publish or deploy build outputs
dotnet minicover uninstrument --workdir ../

# Create HTML reports inside folder coverage-html
# This command returns failure if the coverage is lower than the threshold
dotnet minicover htmlreport --workdir ../ --threshold $threshold

# Print console report
# This command returns failure if the coverage is lower than the threshold
dotnet minicover report --workdir ../ --threshold $threshold

# Create NCover report
dotnet minicover xmlreport --workdir ../ --threshold $threshold

cd ..

Reports

There are 3 types of reports: Console, HTML and NCover XML.

Console report

Console report is dumping results to the console and returns 1 if given threshold is not met, which basically fails the CI/CD build. In the example below, codeCoverage.sh was called with argument 40, which means threshold is 40%.

HTML report

HTML report is also failing the build and gives similar summary information as console report, but also give detailed information for each class coverage. An example report can be found in MiniCover HTML report. I have to praise myself, as the summary file that is shown below was something I contributed, because I like the project very much.

NCover report

NCover report creates XML file in its format. The beauty of it is that you can additionally use ReportGenerator on Windows machine and convert XML to nice HTML report. Assuming ReportGenerator is extracted on your C:\ then the command is shown below. The report can be found in MiniCover ReportGenerator report.

C:\ReportGenerator\ReportGenerator.exe -reports:coverage.xml -targetdir:coverage

Compare with OpenCover

If you check both OpenCover .Net Core report and MiniCover ReportGenerator report you can notice some difference in metrics. First is that MiniCover does not support branch coverage. This is not that bad after all if you have your code nicely indented, line coverage is sufficient. For e.g., if your ternary operator is not on one line, but on three and you have missed testing one of the conditions, then line coverage will state that there is a not tested line. If the ternary operator is on one line though then line coverage will miss this test problem. Another difference is Coverable lines and Covered lines. OpenCover counts opening and closing brackets as such, so its numbers are bigger. Because of this conceptual difference Line coverage percentage has a small difference. MiniCover (35%) is more generous and give more percentage than OpenCover (33.6%).

Conclusion

MiniCover is very nice and compact tool that can be put in place during your continuous integration or continuous delivery to measure code coverage on each build. The most important advantage is that it is designed and works on Linux.

Related Posts

Read more...

Code coverage of .NET Core unit tests with OpenCover

Last Updated on by

Post summary: Examples how to measure code coverage of .NET Core unit tests with OpenCover.

Examples below are based on GitHub SampleDotNetCore2RestStub repository. Examples use code from .NET Core integration testing and mock dependencies post. Those are integration tests because they test more than one application module at a time, but they are run with a unit testing framework, this is why current post title is such.

Code coverage

This topic is how to do the code coverage on .NET Core unit tests with OpenCover. Theory on what is code coverage, why it is needed can be found in What about code coverage post.

OpenCover

OpenCover is open source tool for code coverage for .NET 2.0 and above applications for Windows only. You can read more details about OpenCover in Code coverage of manual or automated tests with OpenCover for .NET applications post or you can visit their OpenCover Wiki page.

Run OpenCover

In order to make this examples work you need to check out SampleDotNetCore2RestStub repository to C:\ and run all commands from project root folder C:\SampleDotNetCore2RestStub. OpenCover and ReportGenerator should be installed in C:\ as well. If you have different paths, just adjust them in commands shown below.

C:\OpenCover\OpenCover.Console.exe `
	-target:"c:\Program Files\dotnet\dotnet.exe" `
	-targetargs:"test" `
	-output:coverage.xml `
	-oldStyle `
	-filter:"+[SampleDotNetCore2RestStub*]* -[SampleDotNetCore2RestStub*Test*]*" `
	-register:user

Enable .NET Core to debug output

If you run the command above you will get the following message:

Committing…
No results, this could be for a number of reasons. The most common reasons are:
1) missing PDBs for the assemblies that match the filter please review the
output file and refer to the Usage guide (Usage.rtf) about filters.
2) the profiler may not be registered correctly, please refer to the Usage
guide and the -register switch.

Note: error with red text shown on image above is because with -targetargs:”test” dotnet.exe tries to run tests inside all projects, but src\SampleDotNetCore2RestStub simply does not have tests. You can refine which test project to get run by changing to: -targetargs:”test test\SampleDotNetCore2RestStub.Integration.Test\SampleDotNetCore2RestStub.Integration.Test.csproj”.

Message for no results is because debug output is not enabled on .NET Core project and OpenCover does not have needed data to work on. Change src\SampleDotNetCore2RestStub\SampleDotNetCore2RestStub.csproj file by adding <DebugType>full</DebugType>:

<PropertyGroup>
	<OutputType>Exe</OutputType>
	<TargetFramework>netcoreapp2.0</TargetFramework>
	<DebugType>full</DebugType>
</PropertyGroup>

Now running the command gives proper output:

Committing…
Visited Classes 5 of 12 (41.67)
Visited Methods 17 of 36 (47.22)
Visited Points 43 of 123 (34.96)
Visited Branches 18 of 44 (40.91)

==== Alternative Results (includes all methods including those without corresponding source) ====
Alternative Visited Classes 5 of 12 (41.67)
Alternative Visited Methods 20 of 43 (46.51)

Generate report

ReportGenerator is used to convert XML reports generated by OpenCoverPartCoverVisual Studio or NCover into human-readable reports in various formats. To generate report use following command:

C:\ReportGenerator\ReportGenerator.exe `
	-reports:coverage.xml `
	-targetdir:coverage

Inspect report

The report can be found in my examples: OpenCover .Net Core report. You can see what code is being covered during testing and what not.

Conclusion

In this post, I have shown how to run code coverage with OpenCover on .NET Core unit tests.

Related Posts

Read more...

Code coverage of manual or automated tests with OpenCover for .NET applications

Last Updated on by

Post summary: Examples how to do code coverage of manual or automated functional test with OpenCover tool for .NET applications

Code coverage

This topic is how to do the code coverage on .NET applications with OpenCover. Theory on what is code coverage, why it is needed can be found in What about code coverage post.

OpenCover

OpenCover is open source tool for code coverage for .NET 2.0 and above applications for Windows only. With OpenCover instrumentation of the code is not needed. The application is started through OpenCover and it collects coverage results. What is mandatory though is PDB file along with executables and assemblies, so application under test should be built in Debug mode. If PDB file is not found then no coverage data will be gathered.

The latest version can be downloaded form Releases in GitHub. There are installer and zip archive. If the installer is used by default OpenCover is installed in C:\Users\{USER_ACCOUNT}\AppData\Local\Apps\OpenCover. If you want to change this, click Advanced button during installation and then select Install for all users on this machine.

How to use OpenCover

Usage guide can be found in OpenCover usage reference online. Also along with OpenCover installation, there is Usage.rft file which holds all the information about the tool. Most useful commands are listed below:

  • -target:<path to target> – the path to application executable file or name of service
  • -filter:<filters> – list of filters to apply to selectively include or exclude assemblies and classes from coverage results
  • -output:<output file> – the path to output XML file, if empty then results.xml will be created the in the current directory
  • -register[:user] – register and de-register the code coverage profiler
  • -targetargs:<target arguments> – arguments to be passed to the target process
  • -targetdir:<target directory> – path to the target directory or alternative path to PDB files

ReportGenerator

OpenCover produces results in raw format, which is not for humans. ReportGenerator is used to convert XML reports generated by OpenCover, PartCover, Visual Studio or NCover into human readable reports in various formats. Usage guide can be found on its home page, most useful commands are:

  • -reports:<report> – coverage reports that should be parsed, semicolon separated, wildcards are allowed
  • -targetdir:<target directory> – directory where the generated report should be saved
  • -sourcedirs:<directory>[;<directory>][;<directory>] – directories which contain the corresponding source code, optional, semicolon separated
  • -classfilters:<(+|-)filter>[;<(+|-)filter>][;<(+|-)filter>] – list of classes that should be included or excluded in the report, optional, wildcards are allowed.

Hands on examples on manual code coverage

In order to try you need to checkout code samples from GitHub SampleApp or SampleAppPlus repository to C:\Telerik Testing Framework needs to be installed as it copies lots of assemblies in GAC. OpenCover and ReportGenerator should also be installed to C:\.

With current setup command to start SimpleAppPlus.exe from OpenCover is:

C:\OpenCover\OpenCover.Console.exe `
	-target:"C:\SampleAppPlus\SampleAppPlus\bin\Debug\SampleAppPlus.exe" `
	-output:C:\SampleAppPlus\CoverageReports\SampelAppPlus.results.xml `
	-register:user

Now the application is started and manual functional tests can be executed. Once the application is stopped coverage results are saved in SampelAppPlus.results.xml file.

Hands on examples on automated code coverage

Since automation is the future of QA and we have already created automated tests for both SimpleApp and SimplaAppPlus, we want to measure how our tests perform on code coverage. Automated tests run the application, attach to it and manipulate it. So it seems close to mind just to use the command from manual example and start the application with it. It will not work though since the command is starting and returning OpenCover process, not underlying SimpleAppPlus one. Extra code is needed in SampleAppPlus.Tests.Framework\Tests\BaseTest.cs file. Instead of:

Application appWhite = Application.Launch(applicationPath);

following code has to be added:

Process sampleAppPlus = StartProcess();
Application appWhite = Application.Attach(sampleAppPlus);

where StartProcess() method is:

using System;
using System.Collections.Generic;
using System.Diagnostics;
using System.Linq;
using System.Threading;

private Process StartProcess()
{
	string appName = "SampleAppPlus";
	string openCover = @"C:\OpenCover\OpenCover.Console.exe";
	long timeStamp = (long)(DateTime.UtcNow 
						- new DateTime(1970, 1, 1)).TotalMilliseconds;

	List<string> arguments = new List<string>();
	arguments.Add(@"-target:C:\SampleAppPlus\SampleAppPlus\bin\Debug\"
					+ appName + ".exe");
	arguments.Add(@"-output:C:\SampleAppPlus\CoverageReports\SampelAppPlus."
					+ timeStamp + ".xml");
	arguments.Add("-register:user");

	Process process = new Process();
	process.StartInfo.FileName = openCover;
	process.StartInfo.Arguments = string.Join(" ", arguments);
	process.Start();

	Thread.Sleep(5000);
	return Process.GetProcesses().First(proc => appName == proc.ProcessName);
}

OpenCover arguments “-target”, “-output” and “-register” are used. Note that -output file is always different by adding current unix time in the file name, this is to prevent overwriting of the file. The idea is to run OpenCover which will start SimpleAppPlus. Wait 5 seconds to ensure the application is up, then get all Windows processes with Process.GetProcesses(), iterate them, find and return the needed SampleAppPlus process which TestStack.White and Telerik Testing Framework will attach to.

Create report

Once tests are run and OpenCover XML report files are generated it is time to generated human readable reports. This is done with ReportGenerator with the command:

C:\ReportGenerator\bin\ReportGenerator.exe `
	-reports:C:\SampleAppPlus\CoverageReports\SampelAppPlus.*.xml `
	-targetdir:C:\SampleAppPlus\CoverageReports\html `
	-sourcedirs:C:\SampleAppPlus\ `
	-classfilters:-SampleAppPlus.Properties.*

OpenCover-report

Inspect report

Coverage report file from examples above can be found in OpenCover code coverage report. Inspecting the report there is missed code in SampleAppPlus.MainWindow class – else branch of if ((bool)openFileDialog.ShowDialog()) condition is not covered. Documentation of this method states that it returns false if Cancel button is clicked of the dialog window. In order to increase the coverage test that clicks Cancel button and verifies no upload is done should be added to test suite.

Code coverage for IIS web application or Windows service

Examples above show how to run a normal windows application. It is valid for both UI and console applications as they are started with single EXE file. OpenCover can also work for IIS web applications, Silverlight applications and Windows service applications. More details can be found in documentation accompanying OpenCover installation.

Although it is possible to connect to a running service, I have done code coverage on Windows service in the manner suggested in the documentation – run the service as a console application. Since debugging a running Windows service is not that straightforward task, developers have most likely already implemented a switch to start service as a console application. If not you will easy their lives by asking them to do so.

Conclusion

OpenCover is the only open source tool for code coverage for .NET applications. It is really powerful and easy to use. No code instrumentation is needed, just build the code into Debug mode to have PDB files and run the application through OpenCover. It can also be used for measuring code coverage of unit tests.

Related Posts

Read more...

Code coverage with JaCoCo offline instrumentation with Maven

Last Updated on by

Post summary: Tutorial how to do code coverage with offline instrumentation with JaCoCo and Maven.

Offline instrumentation

Code coverage of manual or automated tests with JaCoCo post describes how to do code coverage with JaCoCo. This is applicable in many of the cases. Still, there could be a case where the application under test does not support Java agents. In this case, JaCoCo offers offline instrumentation of the code. A once instrumented code can be run and coverage to be measured. This post describes how to do it.

JaCoCo for Maven

JaCoCo Maven plugin is discussed in Automated code coverage of unit tests with JaCoCo and Maven post. In order to get code instrumented “instrument” task should be added to Maven:

<properties>
	<jacoco.skip.instrument>true</jacoco.skip.instrument>
</properties>
<build>
	<plugins>
		<plugin>
			<groupId>org.jacoco</groupId>
			<artifactId>jacoco-maven-plugin</artifactId>
			<version>0.7.4.201502262128</version>
			<executions>
				<execution>
					<id>jacoco-instrument</id>
					<phase>test</phase>
					<goals>
						<goal>instrument</goal>
					</goals>
					<configuration>
						<skip>${jacoco.skip.instrument}</skip>
					</configuration>
				</execution>
			</executions>
		</plugin>
	</plugins>
</build>

In the current example, this task will be executed when mvn test is called. It can be configured to be called on package or install by changing the <phase> element.

Make it configurable

Instrumentation should not be done on every build. You do not want to release instrumented code, first because this is bad practice and second code will not run unless jacocoagent.jar is in the classpath. This is why instrumentation should be disabled by default with jacoco.skip.instrument=true in pom.xml property, which can be overridden when needed with mvn clean test -Djacoco.skip.instrument=false command. Another option is separate pom-offline.xml file and build with it when needed.

Get sample application

Current post uses sample application first introduced in Build a RESTful stub server with Dropwizard post. It can be found in GitHub sample-dropwizard-rest-stub repository. For the current tutorial, it has been downloaded to C:\sample-dropwizard-rest-stub. This application gets packaged to a single JAR file by mvn clean package. If instrumentation gets put in package phase then it is not working, as packaging happens before instrumentation. This is why test phase is the correct for the current example, as package includes test by default.

Instrument the code

Once the application is downloaded it can be built with instrumentation with mvn clean package -Djacoco.skip.instrument=false command. You can easily check if given class has been instrumented by opening it with some kind of decompiler. The image below shows instrumented class on the right hand side vs non-instrumented in the left hand side.

JaCoCo-offline

Run it with JaCoCo agent in the class path

If not instrumented sample application is started with: java -jar target/sample-dropwizard-rest-stub-1.0-SNAPSHOT.jar server config.yml. In case of instrumented code this command will give exception:

Exception in thread “main” java.lang.NoClassDefFoundError: org/jacoco/agent/rt/internal_773e439/Offline

This is because jacocoagent.jar is not in the classpath.

Adding JaCoCo agent in class path varies from case to case. In this particular tutorial application is a single JAR run by java -jar command. In order to add something in classpath java -cp command should be used. Problem is both -jar and -cp are mutually exclusive. Only way to do it is with the following command:

java -Djacoco-agent.output=tcpserver -cp C:\JaCoCo\jacocoagent.jar;target/sample-dropwizard-rest-stub-1.0-SNAPSHOT.jar com.automationrhapsody.reststub.RestStubApp server config.yml

Where -Djacoco-agent.output=tcpserver is configuration to make JaCoCo agent report on TCP port. More about JaCoCo Offline settings here. C:\JaCoCo\jacocoagent.jar is the location of the JaCoCo agent JAR file. com.automationrhapsody.reststub.RestStubApp is the main method to be run from target/sample-dropwizard-rest-stub-1.0-SNAPSHOT.jar file.

Test

Now when we have the application running is time to run all tests we have both automation and manual. For manual, it is important to be documented scenario which is reproducible on each regression testing, not just some random clicking. The idea is that we want to measure what coverage our tests do.

Import coverage results

In order to import results Eclipse with installed JaCoCo plugin from market place is needed. See Code coverage of manual or automated tests with JaCoCo post for more details how to install the plugin.

Open Eclipse and import C:\sample-dropwizard-rest-stub project as Maven one.

Import the results into Eclipse. This is done from File -> Import -> Coverage Session -> select Agent address radio button but leave defaults -> enter some name and select code under test.

JaCoCo-import

Once imported results can be seen and code gets highlighted.

In case no results are imported delete target\classes folder and rebuild with mvn compile.

Export to HTML and analyze

See Code coverage of manual or automated tests with JaCoCo how to export and analyze.

Conclusion

Although very rare to happen offline instrumentation is a way to measure code coverage with JaCoCo.

Related Posts

Read more...

Automated code coverage of unit tests with JaCoCo and Maven

Last Updated on by

Post summary: Tutorial how to setup code coverage with JaCoCo on unit tests to be done on each Maven build.

Code coverage

There are two main streamlines in code coverage. One is running code coverage on each build measuring unit tests coverage. Once configured this needs no manual intervention. Depending on the tools there is even an option to fail the build if code coverage doesn’t reach the desired threshold. Current post is designated to this aspect. Other is running code coverage on automated or even manual functional tests scenarios. Latter is described in Code coverage of manual or automated tests with JaCoCo post.

Unit tests code coverage

The theory described in What about code coverage post is applicable for unit tests code coverage, but the real benefit of unit tests code coverage is:

  • Unit tests code coverage can be automated on every build
  • The build can be configured to fail if a specific threshold is not met

JaCoCo for Maven

There is JaCoCo plugin that is used with Maven builds. More details and what goals can be accomplished with it can be seen in JaCoCo Maven plugin page. The very minimum to make it work is to setup prepare-agent and report goals. Report goal is good to be called during test Maven task. This is done with test instruction. You can define it on other tasks, like install or package, however, code coverage is done for tests. XML block to be added to pom.xml file is:

<plugin>
	<groupId>org.jacoco</groupId>
	<artifactId>jacoco-maven-plugin</artifactId>
	<version>0.7.4.201502262128</version>
	<executions>
		<execution>
			<id>jacoco-initialize</id>
			<goals>
				<goal>prepare-agent</goal>
			</goals>
		</execution>
		<execution>
			<id>jacoco-report</id>
			<phase>test</phase>
			<goals>
				<goal>report</goal>
			</goals>
		</execution>
	</executions>
</plugin>

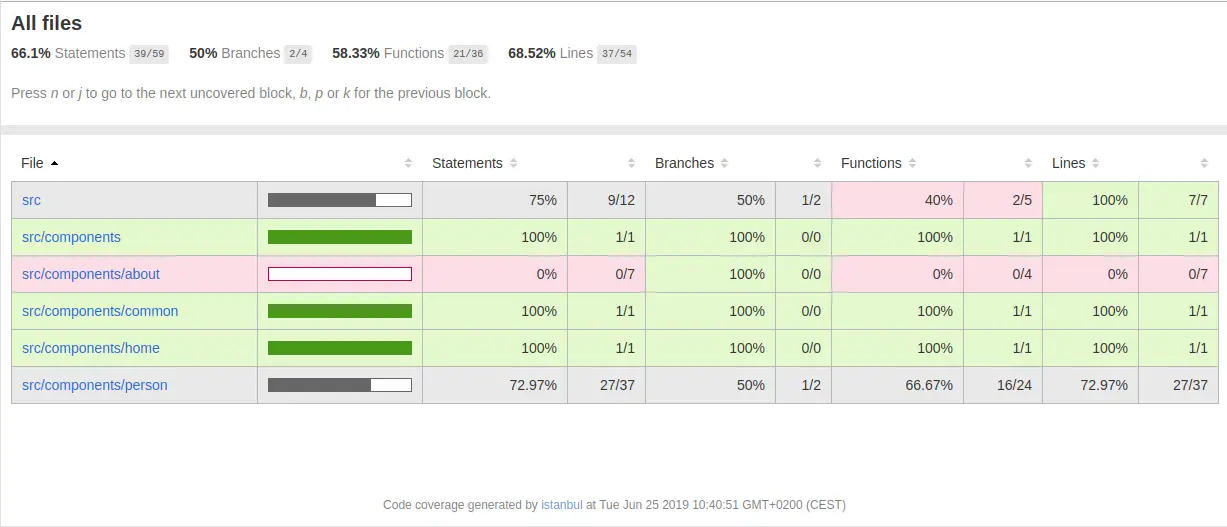
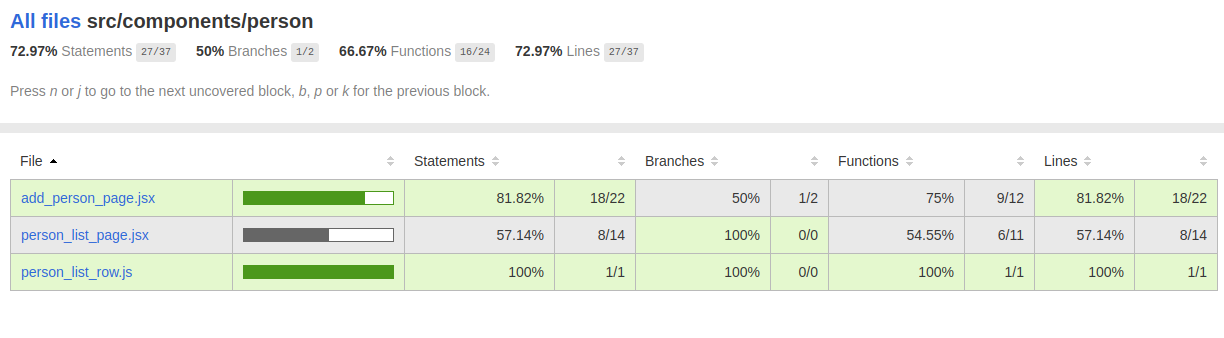
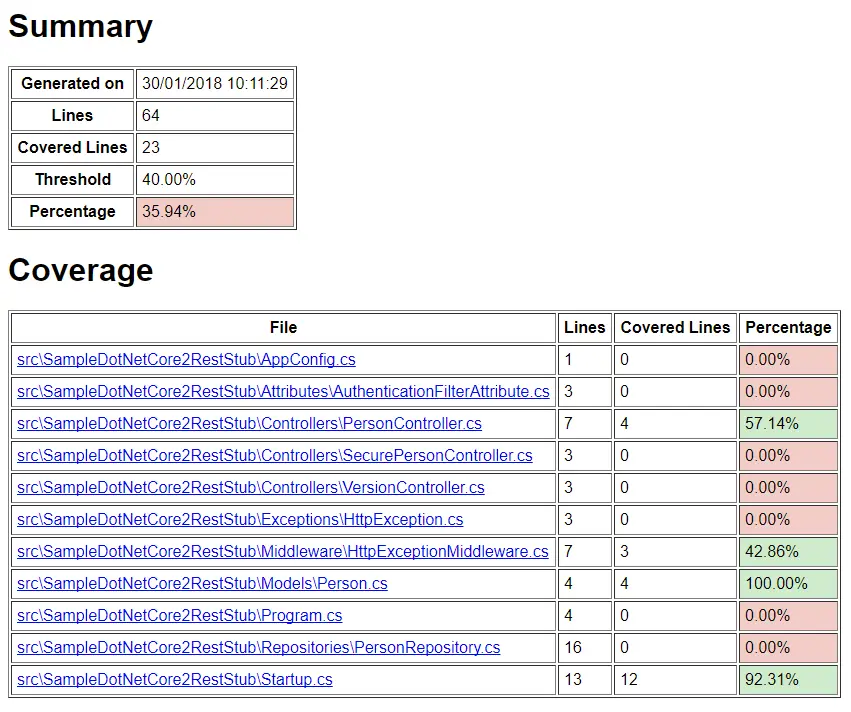
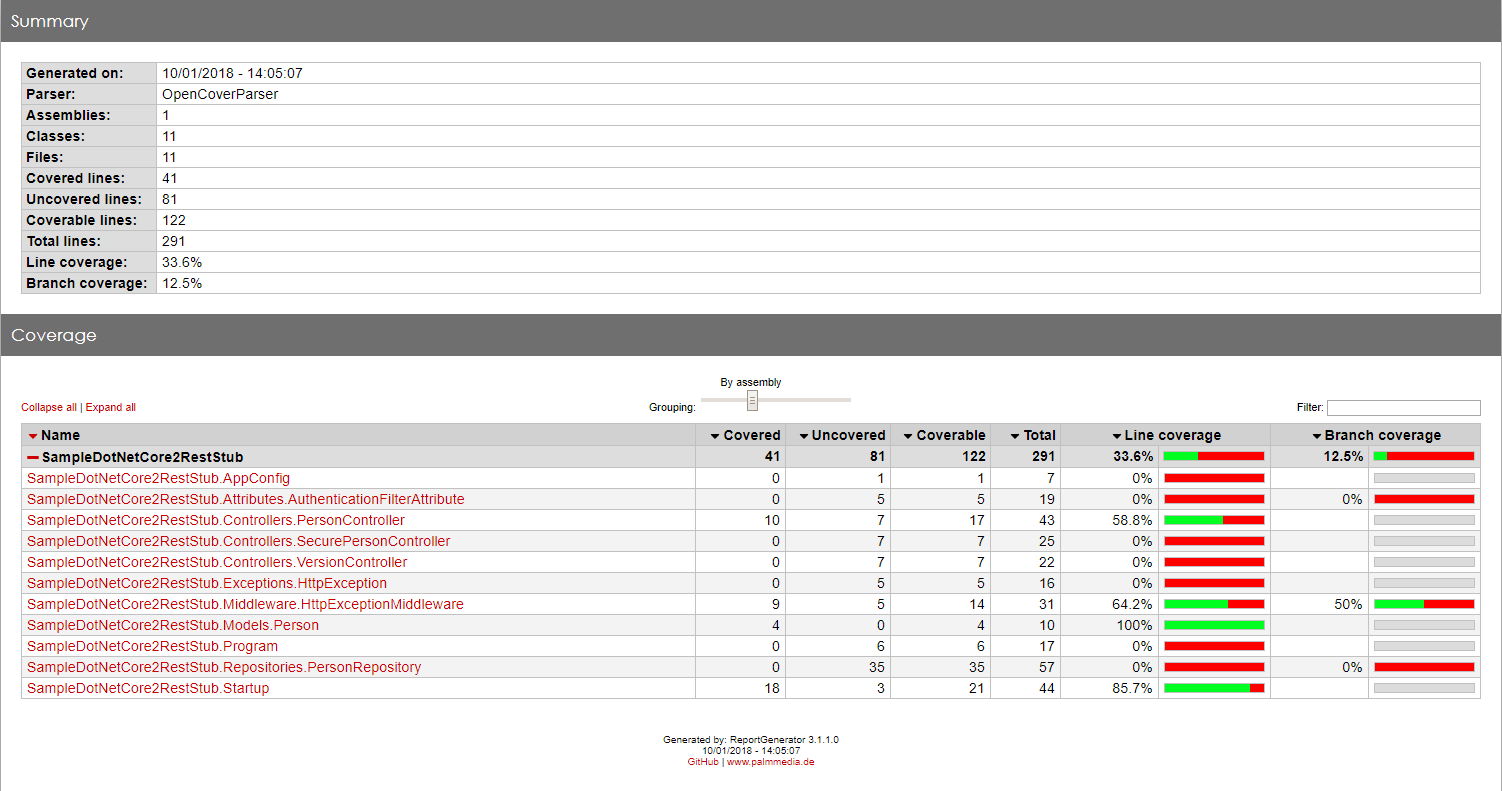
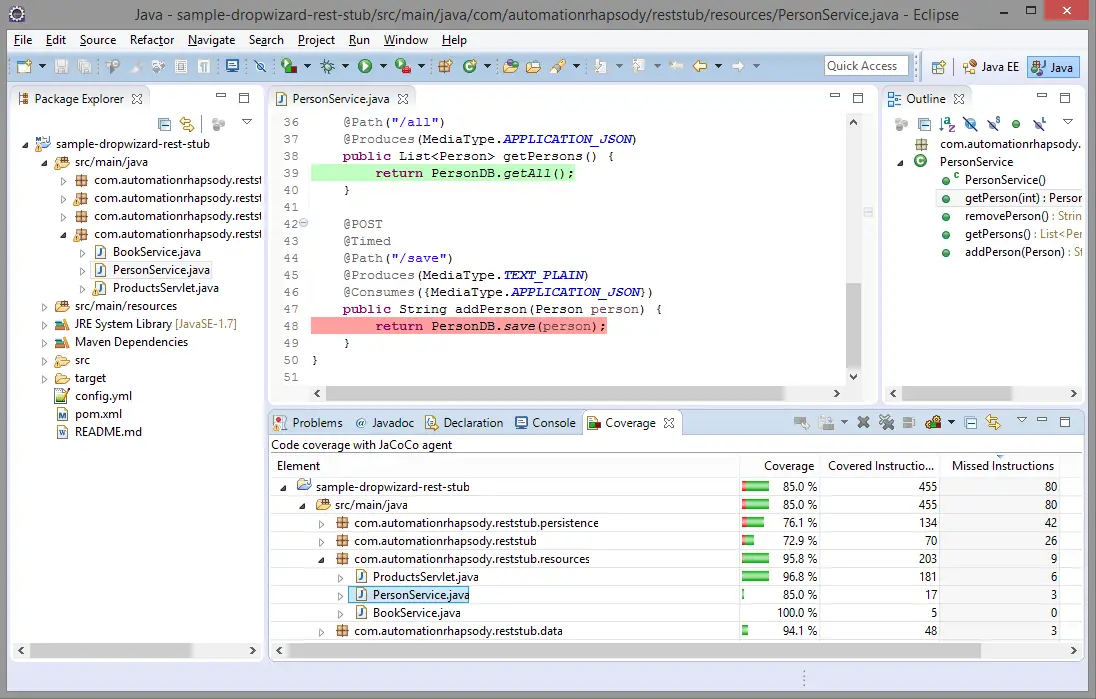
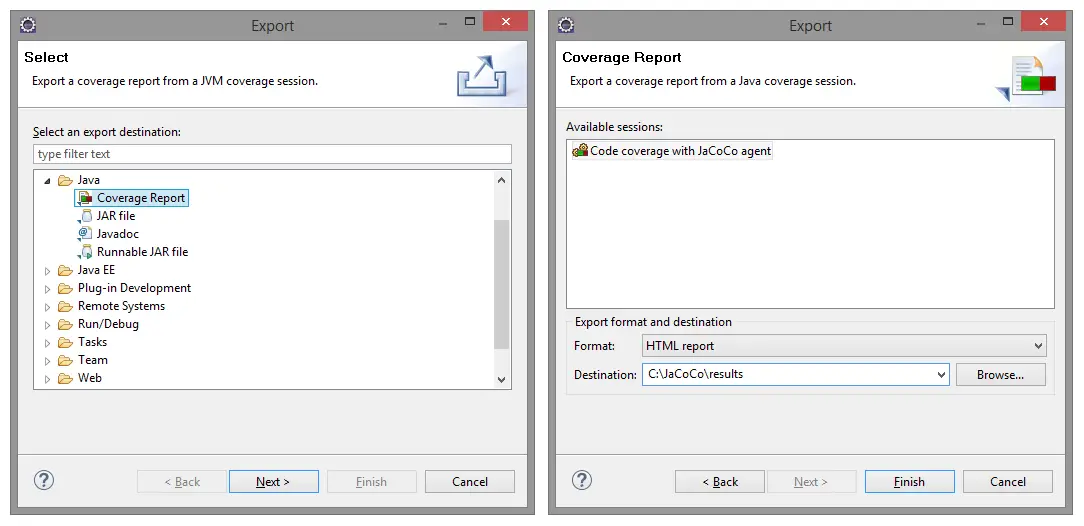
Once this is configured it can be run with mvn clean test command. Once successfully build JaCoCo report can be found in /target/site/jacoco/index.html file. A similar report can be found in HTML JaCoCo report.

Add coverage thresholds

Just adding unit tests code coverage report is good but can be rather improved. A good practice is to add code coverage thresholds. If predefined code coverage percentage is not reached build will fail. This practice could have a negative effect on putting unit tests just for the sake of code coverage, but then again it is up to the development team to keep the good quality. Adding thresholds is done with check Maven task:

<execution>
	<id>jacoco-check</id>
	<phase>test</phase>
	<goals>
		<goal>check</goal>
	</goals>
	<configuration>
		<rules>
			<rule implementation="org.jacoco.maven.RuleConfiguration">
				<element>BUNDLE</element>
				<limits>
					<limit implementation="org.jacoco.report.check.Limit">
						<counter>INSTRUCTION</counter>
						<value>COVEREDRATIO</value>
						<minimum>0.60</minimum>
					</limit>
				</limits>
			</rule>
		</rules>
	</configuration>
</execution>

check task should be added along with prepare-agent. report is not mandatory but could also be added in order to inspect where code coverage is not enough. Note that implementation attribute is mandatory only for Maven 2. If Maven 3 is used then attributes can be removed.

JaCoCo check rules

In order check task to work is should be added at least one goal element as shown above. The rule is defined for a particular scope. Available scopes are: BUNDLE, PACKAGE, CLASS, SOURCEFILE or METHOD. More details can be found in JaCoCo check Maven task documentation. In current example rule is for BUNDLE, which means whole code under analysis. PACKAGE is the far I would go. Even with it, there could be unpleasant surprises like a utility package or POJO (data object without business logic inside) packages where objects do not have essential business logic but the PACKAGE rule will still require given code coverage for this package. This means you will have to write unit tests just to satisfy the coverage demand.

JaCoCo check limits

Although not mandatory each rule is good to have at least one limit element as shown above.

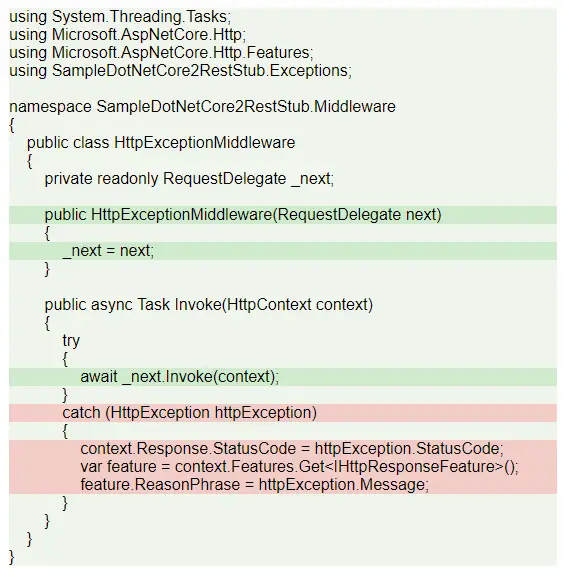
Available limit counters are: INSTRUCTION, LINE, BRANCH, COMPLEXITY, METHOD, CLASS. Those are the values measured in the report. Some of them are JaCoCo specific other are accordance with code coverage general theory. See more details on counters in JaCoCo counters page. Check sample report at HTML JaCoCo report to see how counters are displayed.

Available limit values are: TOTALCOUNT, COVEREDCOUNT, MISSEDCOUNT, COVEREDRATIO, MISSEDRATIO. Those are the magnitude values for measuring. COUNT values are bounding with current implementation and cannot be referred to some industry standards. This is why RATIO values are much more suitable.

Actual measuring value is set in minimum or maximum elements. Minimum is generally used with COVERED values, maximum with MISSED values. Note that in case of RATIO this should be a double value less than 1, e.g. 0.60 in the example above means 60%.

With given counters and values there could be lots of combinations. The very minimum is to use INSTRUCTION with COVEREDRATIO as shown in the example above. Still, if you want to be really precise several limits with different counters can be used. Below is an example of Maven 3 where defining that every class should have been covered in unit tests:

<limit>
	<counter>CLASS</counter>
	<value>MISSEDCOUNT</value>
	<maximum>0</maximum>
</limit>

Configurations are good practice

Hard-coding is never a good practice anywhere. The example above has a hard-coded value of 60% instruction code coverage, otherwise build will fail. This is not a proper way to do it. The proper way is to define a property and then use it. Properties element is defined as a root level:

<properties>
	<jacoco.percentage.instruction>0.60</jacoco.percentage.instruction>
</properties>

...

<limit>
	<counter>INSTRUCTION</counter>
	<value>COVEREDRATIO</value>
	<minimum>${jacoco.percentage.instruction}</minimum>
</limit>

The benefit of a property is that it can be easily overridden at runtime, just specify the new value as a system property: mvn clean test -Djacoco.percentage.instruction=0.20. In this way, there could be a general value of 0.60 in pom.xml, but until this is not reached it can be overridden with 0.20.

Experiment with JaCoCo checks

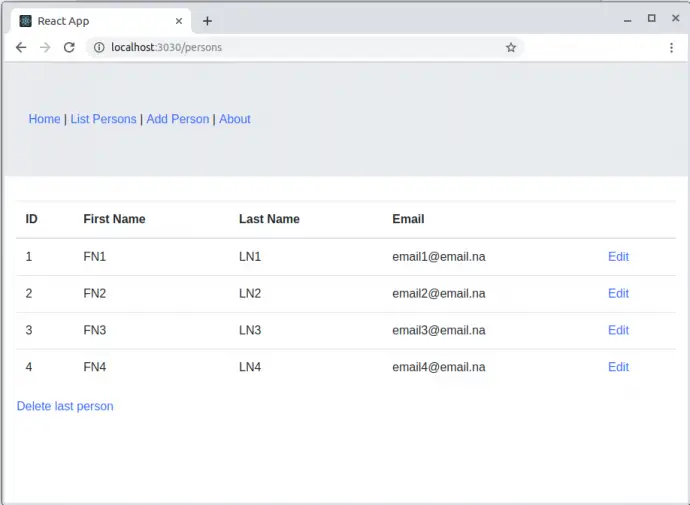
Sample application to experiment with is the one introduced in Build a RESTful stub server with Dropwizard post. It can be found in GitHub sample-dropwizard-rest-stub repository. It has a very low amount of code in it and just one unit test with very low code coverage. This gives good opportunities to try different combinations of counters and values to see how exactly JaCoCo works.

Conclusion

Code coverage of unit tests with thresholds is a good practice. This tutorial gives very good introduction how to implement and use them, so apply and use them.

Related Posts

Read more...

Code coverage of manual or automated tests with JaCoCo

Last Updated on by

Post summary: Tutorial how to do code coverage on automated or even manual functional tests with JaCoCo.

Code coverage is a way to check what part of the code your tests are exercising. JaCoCo is a free code coverage library for Java.

Code coverage

There are two main streamlines in code coverage. One is running code coverage on each build measuring unit tests coverage. Once configured this needs no manual intervention. Depending on the tools there is even an option to fail the build if code coverage doesn’t reach the desired threshold. This is well described in Automated code coverage of unit tests with Maven and JaCoCo post. Another aspect is running code coverage on automated or even manual functional tests scenarios. This post is dedicated to latter. I have already created What about code coverage post to the theory of this type of code coverage. Current post is about getting it done in practice.

The idea

The idea is pretty simple. The application is started with a code coverage tool is attached to it, then tests are executed and results are gathered. This is it. Having stated it that way it doesn’t sound that bizarre to run code coverage on manual tests. Running it makes sense if only tests are well documented and repeatable scenarios that are usually run on regression testing.

JaCoCo Java agent

Java agent is powerful mechanism providing the ability to instrument and change classes at runtime. Java agent library is passed as a JVM parameter when running given application with -javaagent:{path_to_jar}. JaCoCo tool is implemented as Java agent. More details for Java agents can be found at java.lang.instrument package.

In case application under test does not support plugin agents to JVM then coverage can be measured with offline instrumentation described in Code coverage with JaCoCo offline instrumentation with Maven post.

Restrictions

Some restrictions that have to be taken into consideration:

  • JaCoCo plugin is only for Eclipse IDE, hence it should be used in order to get the report
  • Imported execution data must be based on the exact same class files that are also used within the Eclipse IDE, hence application should be run in Eclipse, it is not possible to build it and run it separately as class files will differ
  • Eclipse is not capable of shutting down the JVM, it directly kills it, hence the only way to get results is to start JaCoCo agent in tcpserver output mode
  • JaCoCo agent version 0.7.4 and Eclipse EclEmma plugin 2.3.2 are used, those are compatible, 0.7.5 introduces change in data format

Install Eclipse plugin

Having stated the restriction it is time to start. Installation is done through Eclipse -> Help -> Eclipse Marketplace… -> search for “jacoco” -> Install -> restart Eclipse.

JaCoCo-install

Run the application

As stated in restrictions in order code coverage to work application should be started in Eclipse. I will use sample application I have introduced in Build a RESTful stub server with Dropwizard post. It can be found in GitHub sample-dropwizard-rest-stub repository. For this tutorial, it is checked out to: C:\sample-dropwizard-rest-stub.

Download JaCoCo 0.7.4 agent jar. For this tutorial it is saved to C:\JaCoCo

Project have to imported to Eclipse from File -> Import -> Existing Maven projects. Once imported Run configuration have to be done from Run -> Run Configurations… -> double click Java Application. This opens new window to define configuration. Properties are stated below:

  • Name (Main tab): RestStubApp (could be whatever name)
  • Project (Main tab): sample-dropwizard-rest-stub
  • Main class (Main tab): com.automationrhapsody.reststub.RestStubApp
  • Program arguments (Arguments tab): server config.yml
  • VM arguments (Arguments tab): -javaagent:C:\JaCoCo\jacocoagent.jar=output=tcpserver (started in “tcpserver” output mode)
  • Working directory -> Other (Arguments tab): C:\sample-dropwizard-rest-stub

JaCoCo-run

Once the configuration is created then run it.

Apart from the given sample application, it should be possible to run every application in Eclipse. This assumption is made on the fact that developers do need to debug their application, so they will have a way to run it. The important part is to include -javaagent: part in VM arguments section

Test

Now when we have the application running is time to run all tests we have both automation and manual. For manual, it is important to be documented scenario which is reproducible in each regression testing, not just some random clicking. The idea is that we want to measure what coverage our tests do.

Import coverage results

After all tests have passed it is time to import the results into Eclipse. This is done from File -> Import -> Coverage Session -> select Agent address radio button but leave defaults -> enter some name and select code under test.

JaCoCo-import

Once imported results can be seen and code gets highlighted.

JaCoCo-results

Export to HTML

Now result can be exported. There are several options: HTML, zipped HTML, XML, CSV or JaCoCo execution data file. Export is done from: File -> Export -> Coverage Report -> select session and location.

JaCoCo-export

Analyse

Here comes the hard part. The code could be quite complex and not that easy to understand. In the current tutorial, code is pretty simple. Inspecting HTML JaCoCo report it can be easily noticed that addPerson() method has not been called. This leads to a conclusion that one test has been missed – to invoke all persons endpoint. Another finding is that ProductServlet hasn’t been tested with empty product id.

Conclusion

It is pretty easy to measure the code coverage. Whether to do it is another discussion held in What about code coverage post. If there is a time it might be beneficial. But do not make code coverage an important KPI as this could lead to aimless test with only one purpose – higher percentage. Code coverage should be done in order to optimize tests and search for gaps.

Related Posts

Read more...

What about code coverage

Last Updated on by

Post summary: Code coverage is a measurement of what percentage of program source code is being executed by your tests. Code coverage is a nice to have, but in no case make code coverage ultimate goal!

Code coverage is a useful metric to check what part of the code your tests are exercising. Is really depends on the tools to be used for gathering code coverage metrics but in general, they work in similar fashion.

How it works

One approach is to instrument application under test. Instrumentation is to modify original executables by adding metadata so code coverage tool is able to understand which line of code is being executed. Another option is to run the application through code coverage tool. In both ways, once the application is running tests are being executed.

What tests to run

Tests that can be run to measure code coverage can be unit tests, functional automation tests or even manual tests. It doesn’t matter the important part is to see how our tests are impacting application under test.

Results

Once tests are finished code coverage metrics are obtained from code coverage tool. To have detailed information most of the tools take the original source code and generate a visual report with color information which line is executed and which not. There are different levels of coverage, method, line, code block, etc. I personally prefer lines and when speaking further I’ll mean lines of code executed.

Benefits

Code coverage information is equally useful for QA and developers. QA analyze code that has not being executed during tests to identify what tests conditions they are missing and improve their tests. Developers analyze the results to identify and remove dead or unused code.

When to do it

Code coverage of unit tests is good to be done on each build. Those can be scheduled in continuous integration jobs and can be run unattended. Code coverage on automated or manual tests is more like a nice to have activity. We can live with or without it. It is useful for big matured products where there are automation test suites. You can also do them against your tests code in order to optimize it. Removing dead code optimizes the product and makes its maintenance easier. I would say doing it too often should be avoided. Everything depends on context but for me best is once or twice a year.

What does code coverage percentage mean

In one word – nothing. You may have 30% of code coverage but to cover most important user functionality and bug rate to be relatively low and you may have 90% with dummy tests made especially to exercise some code without the idea of actually testing it. I was lucky to work on a project where developers keep the code tidy and clean and my tests easily accomplished 81% just by verifying all user requirements. I may say 80-85% is the maximum you may get.

Pitfalls

I would not recommend putting code coverage as an important measurement or key performance indicator (KPI) in your testing strategy. Doing so and making people try to increase the code coverage will in most cases result in dummy tests made especially this percentage to go up. Code coverage is in most cases insignificant aspect of your testing strategy.

How to do it

Practical tutorials on how to do code coverage with Java, C#, and JavaScript can be found on my blog:

Conclusion

Code coverage is an interesting aspect of testing. It might enhance your tests if done wisely or it can ruin them. Remember tests scenarios should be extracted from user requirements and features. Code coverage data should be used to see if you have some blind spots reading the requirements. It can help developers remove dead or unused code.

Related Posts

Read more...