Post summary: How to extract metrics from spans by OpenTelementry collector, store them in Prometheus and properly visualize them in Grafana.
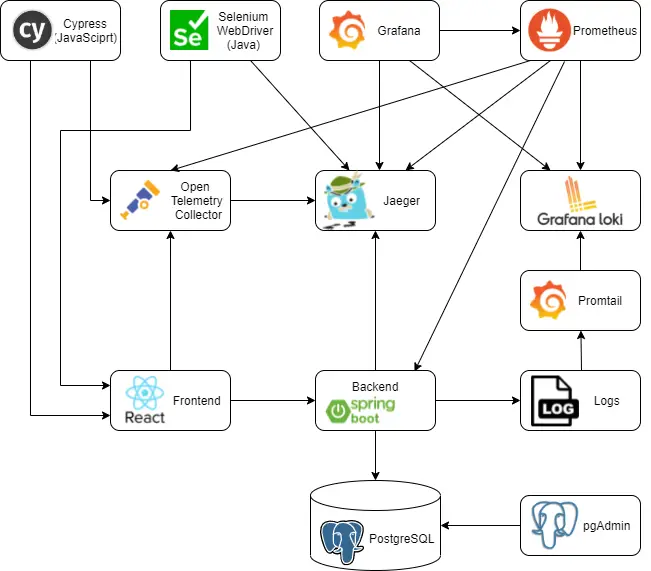
This post is part of Distributed system observability: complete end-to-end example series. The code used for this series of blog posts is located in selenium-observability-java GitHub repository.
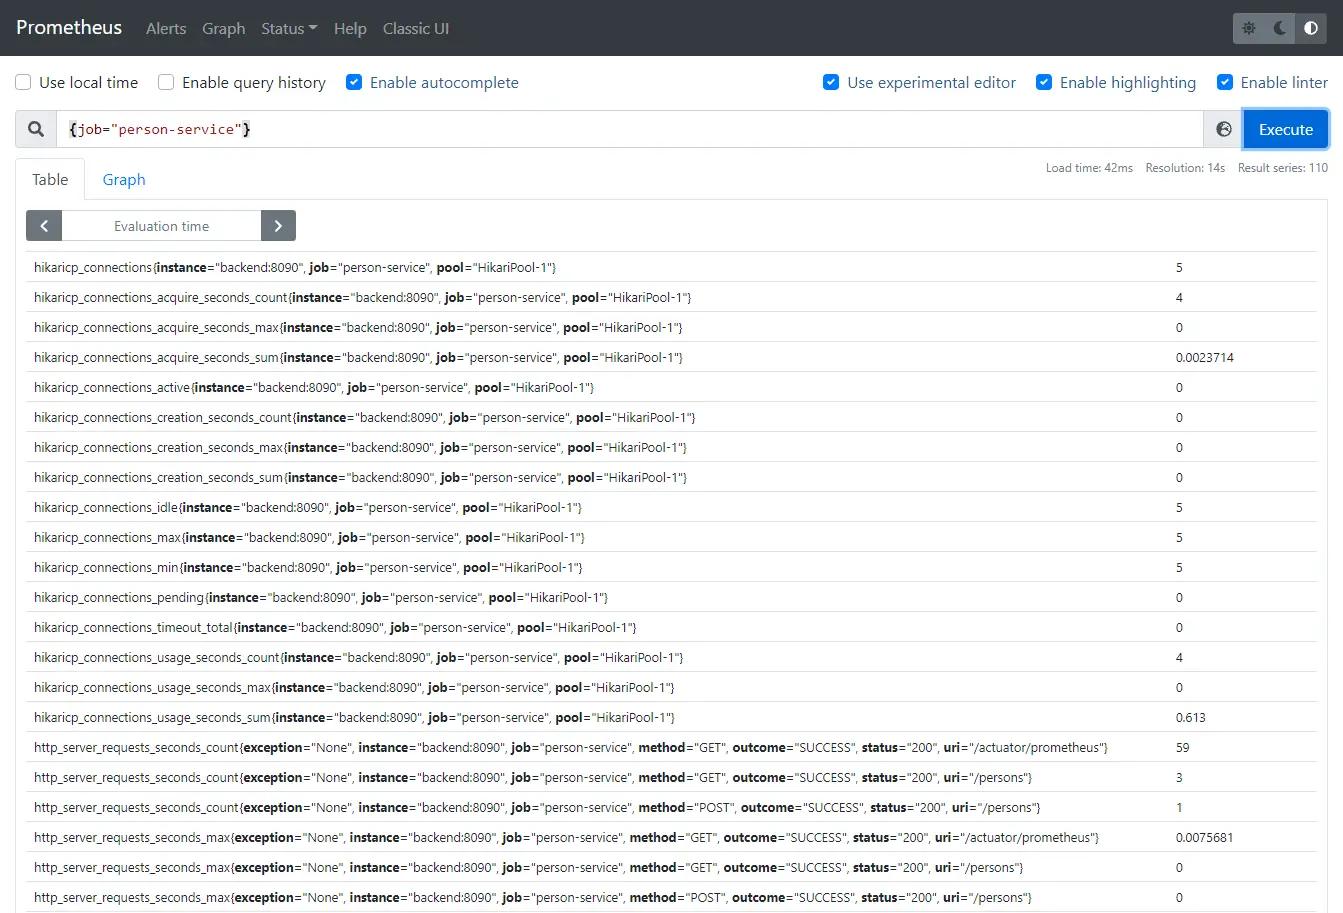
Prometheus and metrics
Prometheus is an open-source monitoring and alerting toolkit. Prometheus collects and stores its metrics. Metrics information is stored with the timestamp at which it was recorded, alongside optional key-value pairs called labels. Metric is a way to measure something, e.g. how many people had read the current article. Metrics change over time, and Prometheus is recording and graphically visualizing the change over time.
Extract metrics from spans in OpenTelementry Collector
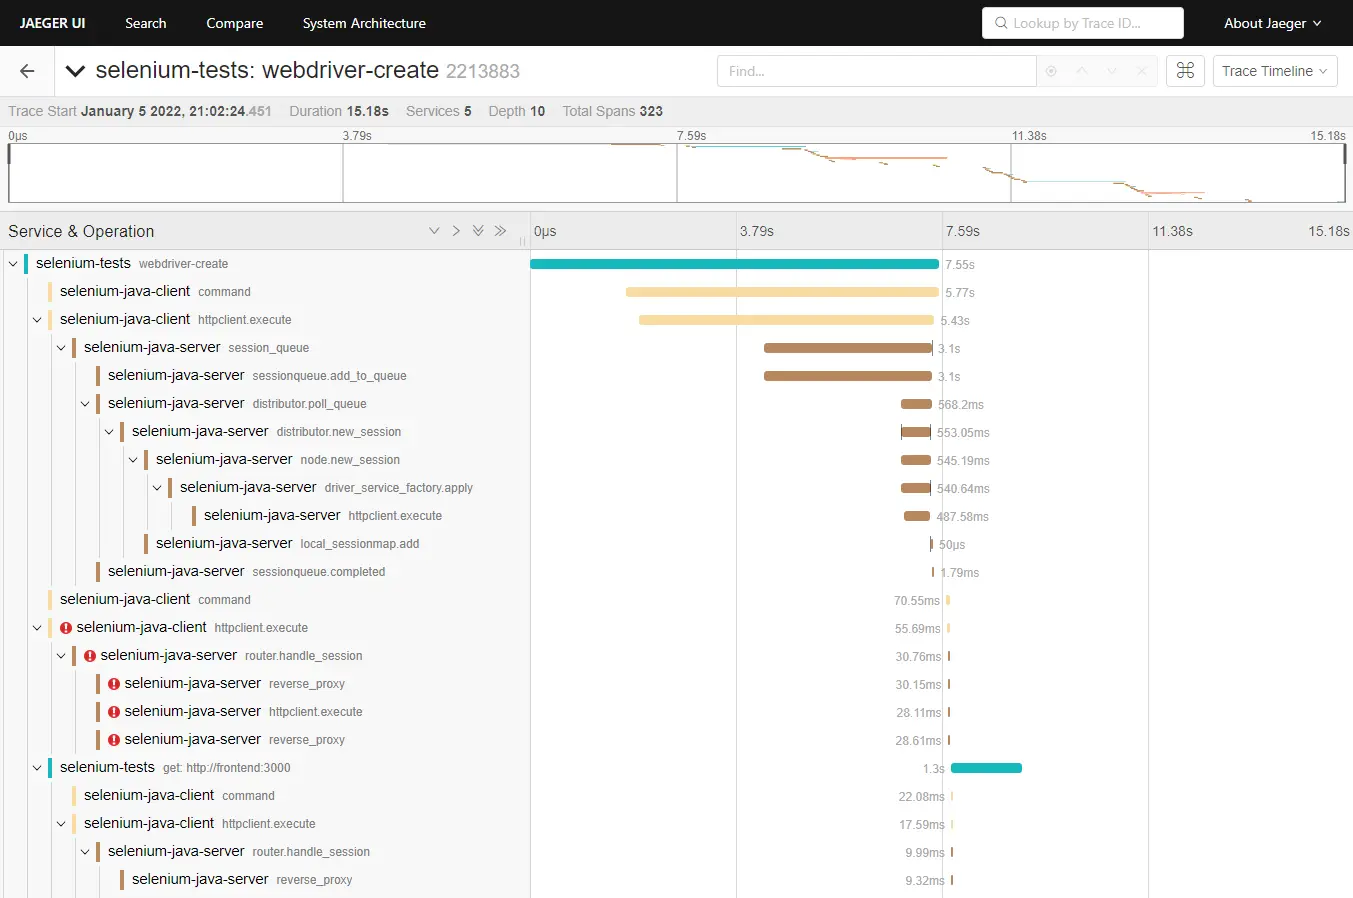
OpenTelemetry collector receives tracing data from the frontend, converts it into Jaeger format, and exports it to the Jaeger backend. Every span has duration, which is a metric. In order to extract the metric, the Span Metrics Processor contributors library is used. Full configurations are in otel-config.yaml. In the file are configured receivers, processors, exporters, and service, There are two receivers: oltp is receiving the traces; otlp/spanmetrics is a dummy receiver, that is never used, but the pipeline requires one to be present. There are two processors: batch compresses the data into batches and optimizes data transmission; spanmetrics extracts the metrics from spans. Spanmetrics configuration should have metrics_exporter, prometheus in the current case, which is existing in the exporters section of the configuration. An optional configuration is latency_histogram_buckets, which defines the histogram buckets. This is a very important concept and will be explained later. There are two exporters: jaeger sends the data to Jaeger backend; prometheus defines an endpoint, which Prometheus can fetch the metrics from, 0.0.0.0:8889 in the current example. Port 8889 also has to be exposed in docker-compose.yml file. The service section is used to configure what components are enabled. In the current example, otlp receiver takes the traces and exports them to jaeger, also traces are being processed by spanmetrics processor and exported as metrics to prometheus endpoint. More details can be found in OpenTelemetry Collector configuration.
receivers:
  otlp:
    protocols:
      grpc:
      http:
  otlp/spanmetrics:
    protocols:
      grpc:
        endpoint: 0.0.0.0:12346

processors:
  batch:
  spanmetrics:
    metrics_exporter: prometheus
    latency_histogram_buckets:
      [200ms, 400ms, 800ms, 1s, 1200ms, 1400ms, 1600ms, 1800ms, 2s, 5s, 7s]

exporters:
  jaeger:
    endpoint: jaeger:14250
    tls:
      insecure: true
  prometheus:
    endpoint: 0.0.0.0:8889
    metric_expiration: 1440m

service:
  pipelines:
    traces:
      receivers: [otlp]
      processors: [spanmetrics, batch]
      exporters: [jaeger]
    metrics:
      receivers: [otlp/spanmetrics]
      exporters: [prometheus]
Prometheus histogram by OpenTelemetry Collector
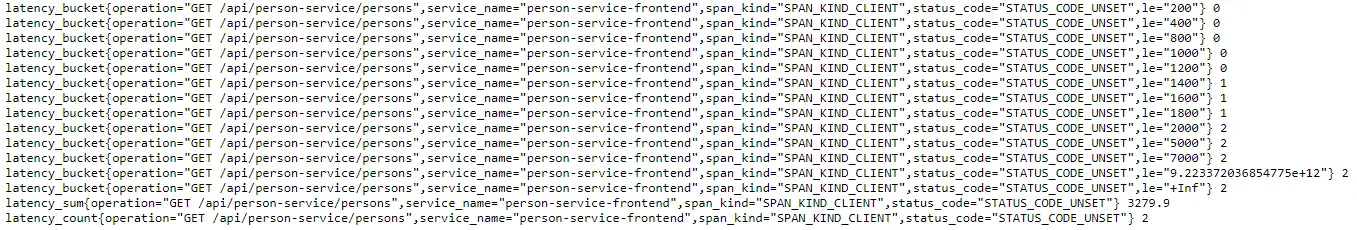
A Prometheus histogram collects metrics and counts them in configurable buckets. It also provides a sum of all observed values. Buckets are separate measurable dimensions that metrics are put into. In the current example, the buckets are [200ms, 400ms, 800ms, 1s, 1200ms, 1400ms, 1600ms, 1800ms, 2s, 5s, 7s]. Spans that are being received by the frontend are compared by their duration and put into a separate metric bucket. The easiest way to illustrate this is with an example. If a request takes 1.29 seconds, then buckets from 200ms to 1200ms are untouched, all other buckets from 1400ms to 7s are increased with a value of 1. When the next request comes with a duration of 1.99 seconds, then buckets from 200ms to 1800ms are untouched, buckets from 2s to 7s are increased with a value of 1. This is hard to understand but is a very important concept. You can experiment by running the examples, then open the frontend at http://localhost:3000/, and click the “Fetch persons” button. Observe the metrics buckets at OpenTelemetry Collector http://localhost:8889/metrics. The metrics of the two example requests above are visialized in the screenshot below. Buckets are with name latency_bucket and additional labels to identify the correct span. The span name is set into the operation label in the bucket. In the current example, “GET /api/person-service/persons” span is used. Along with the configured buckets, there are two additional buckets – 9.223372036854775e+12 – I truly do not what that is, and +Inf – this is the default bucket for all requests which does not fit the predefined buckets, i.e. longer than 7 seconds. There are two more counters – latency_sum – the total time in milliseconds that all the requests took, in our case – 1.29s + 1.99s = 3279ms; latency_count – the total number of requests, in our case – 2.
Visualize in Grafana
The two requests listed above are visualized in Grafana as shown below, one request is in the 1400ms (1200ms-1400ms) bucket, one request is in the 2000ms (1800ms-2000ms) bucket.
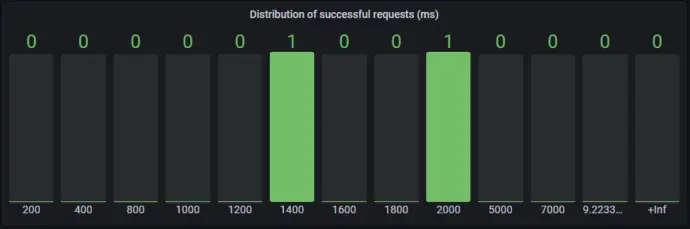
The panel above is defined in Grafana. It is a Bar gauge, the data source is Prometheus, Metric browser is latency_bucket{operation=”GET /api/person-service/persons”,service_name=”person-service-frontend”,span_kind=”SPAN_KIND_CLIENT”,status_code=”STATUS_CODE_UNSET”}, Legend is {{le}}, Min step is 1, Format is Heatmap.

Working with histogram buckets is a complex task, How to visualize Prometheus histograms in Grafana post gives good guidance.
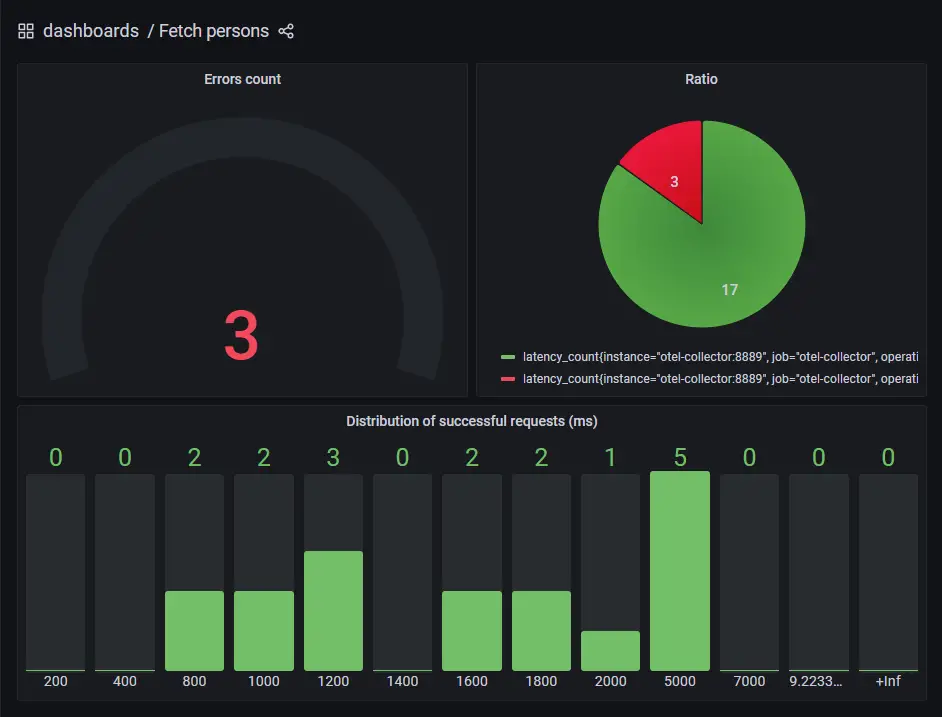
A custom dashboard is created in the examples, it is accessible at http://localhost:3001/d/bgZ6Mf5nk/fetch-persons?orgId=1. The dashboard is defined in etc/grafana-custom-dashboard.json file.
Conclusion
In the current post, I have shown how to make OpenTelemetry Collector convert the spans into metrics, which can be fetched by Prometheus and visualized in Grafana.