Performance testing in the browser

Last Updated on by

Post summary: Approaches for performance testing in the browser using Puppeteer, Lighthouse, and PerformanceTiming API.

In the current post, I will give some examples of how performance testing can be done in the browser using different metrics. Puppeteer is used as a tool for browser manipulation because it integrates easily with Lighthouse and DevTools Protocol. I have described all the tools before giving any examples. The code can be found in GitHub sample-performance-testing-in-browser repository.

Why?

Many things can be said on why do we do performance testing and why especially the browser. In How to do proper performance testing post I have outlined idea how to cover the backend. Assuming it is already optimized, and still, customer experience is not sufficient it is time to look at the frontend part. In general, performance testing is done to satisfy customers. It is up to the business to decide whether performance testing will have some ROI or not. In this article, I will give some ideas on how to do performance testing of the frontend part, hence in the browser.

Puppeteer

Puppeteer is a tool by Google which allows you to control Chrome or Chromium browsers. It works over DevTools Protocol, which I will describe later. Puppeteer allows you to automate your functional tests. In this regards, it is very similar to Selenium but it offers many more features in terms of control, debugging, and information within the browser. Over the DevTools Protocol, you have programmatically access to all features available in DevTools (the tool that is shown in Chrome when you hit F12). You can check Puppeteer API documentation or check advanced Puppeteer examples such as JS and CSS code coverage, site crawler, Google search features checker.

Lighthouse

Lighthouse is again tool by Google which is designed to analyze web apps and pages, making a detailed report about performance, SEO, accessibility, and best practices. The tool can be used inside Chrome’s DevTools, standalone from CLI (command line interface), or programmatically from Puppeteer project. Google had developed user-centric performance metrics which Lighthouse uses. Here is a Lighthouse report example run on my blog.

PerformanceTimings API

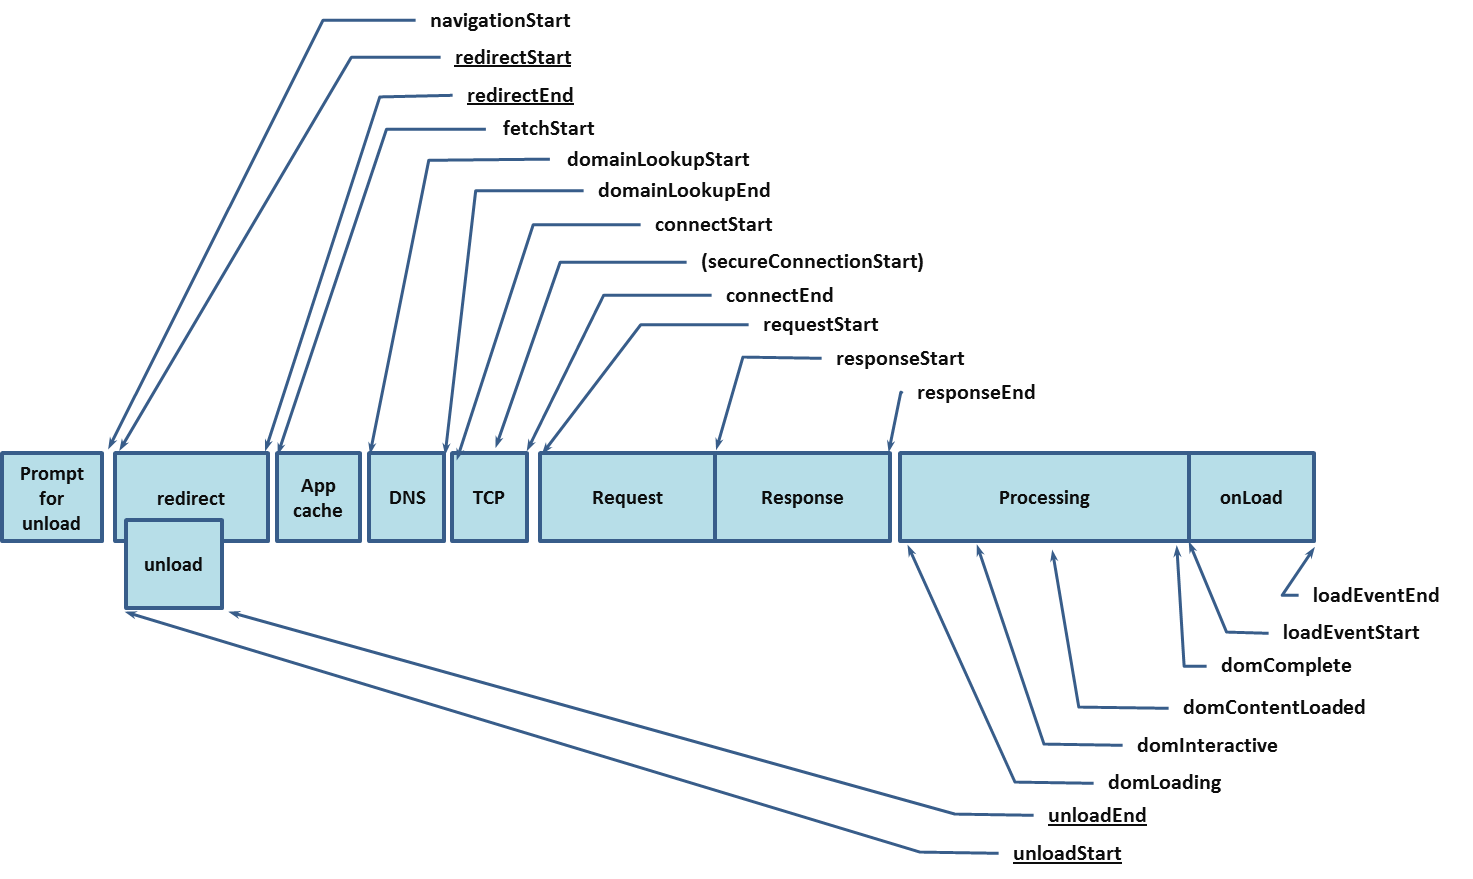
W3C have Navigation Timing recommendation which is supported by major browsers. The interesting part is the PerformanceTiming interface, where various timings are exposed.

DevTools Protocol

DevTools Protocol comes by Google and is a way to communicate programmatically with DevTools within Chrome and Chromium, hence you can instrument, inspect, debug, and profile those browsers.

Examples

Now comes the fun part. I have prepared several examples. All the code is in GitHub sample-performance-testing-in-browser repository.

  • Puppeteer and Lighthouse – Puppeteer is used to login and then Lighthouse checks pages for logged in user.
  • Puppeteer and PerformanceTiming API – Puppeteer navigates the site and gathers PerformanceTiming metrics from the browser.
  • Lighthouse and PerformanceTiming API – comparison between both metrics in Lighthouse and NavigationTiming.
  • Puppeteer and DevTools Protocol – simulate low bandwidth network conditions with DevTools Protocol.

Before proceeding with the examples I will outline helper functions used to gather metrics. In the examples, I use Node.js 8 which supports async/await functionality. With it, you can use an asynchronous code in a synchronous manner.

Gather single PerformanceTiming metric

async function gatherPerformanceTimingMetric(page, metricName) {
  const metric = await page.evaluate(metric => 
     window.performance.timing[metric], metricName);
  return metric;
}

I will not go into details about Puppeteer API. I will describe the functions I have used. Function page.evaluate() executes JavaScript in the browser and can return a result if needed. window.performance.timing returns all metrics from the browser and only needed by metricName one is returned by the current function.

Gather all PerformaceTiming metrics

async function gatherPerformanceTimingMetrics(page) {
  // The values returned from evaluate() function should be JSON serializable.
  const rawMetrics = await page.evaluate(() => 
    JSON.stringify(window.performance.timing));
  const metrics = JSON.parse(rawMetrics);
  return metrics;
}

This one is very similar to the previous. Instead of just one metric, all are returned. The tricky part is the call to JSON.stringify(). The values returned from page.evaluate() function should be JSON serializable. With JSON.parse() they are converted to object again.

Extract data from PerformanceTiming metrics

async function processPerformanceTimingMetrics(metrics) {
  return {
    dnsLookup: metrics.domainLookupEnd - metrics.domainLookupStart,
    tcpConnect: metrics.connectEnd - metrics.connectStart,
    request: metrics.responseStart - metrics.requestStart,
    response: metrics.responseEnd - metrics.responseStart,
    domLoaded: metrics.domComplete - metrics.domLoading,
    domInteractive: metrics.domInteractive - metrics.navigationStart,
    pageLoad: metrics.loadEventEnd - metrics.loadEventStart,
    fullTime: metrics.loadEventEnd - metrics.navigationStart
  }
}

Time data for certain events are compiled from raw metrics. For e.g., if DNS lookup or TCP connection times are slow, then this could be some network specific thing and may not need to be acted. If response time is very high, then this is indicator backend might not be performing well and needs to be further performance tested. See How to do proper performance testing post for more details.

Gather Lighthouse metrics

const lighthouse = require('lighthouse');

async function gatherLighthouseMetrics(page, config) {
  // ws://127.0.0.1:52046/devtools/browser/675a2fad-4ccf-412b-81bb-170fdb2cc39c
  const port = await page.browser().wsEndpoint().split(':')[2].split('/')[0];
  return await lighthouse(page.url(), { port: port }, config).then(results => {
    delete results.artifacts;
    return results;
  });
}

The example above shows how to use Lighthouse programmatically. Lighthouse needs to connect to a browser on a specific port. This port is taken from page.browser().wsEndpoint() which is in format ws://127.0.0.1:52046/devtools/browser/{GUID}. It is good to delete results.artifacts; because they might get very big in size and are not needed. The result is one huge object. I will talk about this is more details. Before using Lighthouse is should be installed in a Node.js project with npm install lighthouse –save-dev.

Puppeteer and Lighthouse

In this example, Puppeteer is used to navigating through the site and authenticate the user, so Lighthouse can be run for a page behind a login. Lighthouse can be run through CLI as well but in this case, you just pass and URL and Lighthouse will check it.

puppeteer-lighthouse.js

const puppeteer = require('puppeteer');
const perfConfig = require('./config.performance.js');
const fs = require('fs');
const resultsDir = 'results';
const { gatherLighthouseMetrics } = require('./helpers');

(async () => {
  const browser = await puppeteer.launch({
    headless: true,
    // slowMo: 250
  });
  const page = await browser.newPage();

  await page.goto('https://automationrhapsody.com/examples/sample-login/');
  await verify(page, 'page_home');

  await page.click('a');
  await page.waitForSelector('form');
  await page.type('input[name="username"]', 'admin');
  await page.type('input[name="password"]', 'admin');
  await page.click('input[type="submit"]');
  await page.waitForSelector('h2');
  await verify(page, 'page_loggedin');

  await browser.close();
})();

verify()

const perfConfig = require('./config.performance.js');
const fs = require('fs');
const resultsDir = 'results';
const { gatherLighthouseMetrics } = require('./helpers');

async function verify(page, pageName) {
  await createDir(resultsDir);
  await page.screenshot({
    path: `./${resultsDir}/${pageName}.png`,
    fullPage: true
  });
  const metrics = await gatherLighthouseMetrics(page, perfConfig);
  fs.writeFileSync(`./${resultsDir}/${pageName}.json`,
    JSON.stringify(metrics, null, 2));
  return metrics;
}

createDir()

const fs = require('fs');

async function createDir(dirName) {
  if (!fs.existsSync(dirName)) {
    fs.mkdirSync(dirName, '0766');
  }
}

A new browser is launched with puppeteer.launch(), arguments { headless: true, //slowMo: 250 } are put for debugging purposes. If you want to view what is happening then set headless to false and slow the motions with slowMo: 250, where time is in milliseconds. Start a new page with browser.newPage() and navigate to some URL with page.goto(‘URL’). Then verify() function is invoked. It is shown on the second tab and will be described in a while. Next functionality is used to log in the user. With page.click(‘SELECTOR’), where CSS selector is specified, you can click an element on the page. With page.waitForSelector(‘SELECTOR’) Puppeteer should wait for the element with the given CSS selector to be shown. With page.type(‘SELECTOR’, ‘TEXT’) Puppeteer types the TEXT in the element located by given CSS selector. Finally browser.close() closes the browser.

So far only Puppeteer navigation is described. Lighthouse is invoked in verify() function. Results directory is created initially with createDir() function. Then a screenshot is taken on the full page with page.screenshot() function. Lighthouse is called with gatherLighthouseMetrics(page, perfConfig). This function was described above. Basically, it gets the port on which DevTools Protocol is currently running and passes it to lighthouse() function. Another approach could be to start the browser with hardcoded debug port of 9222 with puppeteer.launch({ args: [ ‘–remote-debugging-port=9222’ ] }) and pass nothing to Lighthouse, it will try to connect to this port by default. Function lighthouse() accepts also an optional config parameter. If not specified then all Lighthouse checks are done. In the current example, only performance is important, thus a specific config file is created and used. This is config.performance.js file.

Puppeteer and PerformanceTiming API

In this example, Puppeteer is used to navigating the site and extract PerformanceTiming metrics from the browser.

const puppeteer = require('puppeteer');
const { gatherPerformanceTimingMetric,
  gatherPerformanceTimingMetrics,
  processPerformanceTimingMetrics } = require('./helpers');

(async () => {
  const browser = await puppeteer.launch({
    headless: true
  });
  const page = await browser.newPage();
  await page.goto('https://automationrhapsody.com/');

  const rawMetrics = await gatherPerformanceTimingMetrics(page);
  const metrics = await processPerformanceTimingMetrics(rawMetrics);
  console.log(`DNS: ${metrics.dnsLookup}`);
  console.log(`TCP: ${metrics.tcpConnect}`);
  console.log(`Req: ${metrics.request}`);
  console.log(`Res: ${metrics.response}`);
  console.log(`DOM load: ${metrics.domLoaded}`);
  console.log(`DOM interactive: ${metrics.domInteractive}`);
  console.log(`Document load: ${metrics.pageLoad}`);
  console.log(`Full load time: ${metrics.fullTime}`);

  const loadEventEnd = await gatherPerformanceTimingMetric(page, 'loadEventEnd');
  const date = new Date(loadEventEnd);
  console.log(`Page load ended on: ${date}`);

  await browser.close();
})();

Metrics are extracted with gatherPerformanceTimingMetrics() function described above and then data is collected from the metrics with processPerformanceTimingMetrics(). In the end, there is an example of how to extract one metric such as loadEventEnd and display it as a date object.

Lighthouse and PerformanceTiming API

const puppeteer = require('puppeteer');
const perfConfig = require('./config.performance.js');
const { gatherPerformanceTimingMetrics,
  gatherLighthouseMetrics } = require('./helpers');

(async () => {
  const browser = await puppeteer.launch({
    headless: true
  });
  const page = await browser.newPage();
  const urls = ['https://automationrhapsody.com/',
    'https://automationrhapsody.com/examples/sample-login/'];

  for (const url of urls) {
    await page.goto(url);

    const lighthouseMetrics = await gatherLighthouseMetrics(page, perfConfig);
    const firstPaint = parseInt(lighthouseMetrics.audits['first-meaningful-paint']['rawValue'], 10);
    const firstInteractive = parseInt(lighthouseMetrics.audits['first-interactive']['rawValue'], 10);
    const navigationMetrics = await gatherPerformanceTimingMetrics(page);
    const domInteractive = navigationMetrics.domInteractive - navigationMetrics.navigationStart;
    const fullLoad = navigationMetrics.loadEventEnd - navigationMetrics.navigationStart;
    console.log(`FirstPaint: ${firstPaint}, FirstInterractive: ${firstInteractive}, 
      DOMInteractive: ${domInteractive}, FullLoad: ${fullLoad}`);
  }

  await browser.close();
})();

This example shows a comparison between Lighthouse metrics and PerformanceTiming API metrics. If you run the example and compare all the timings you will notice how much slower the site looks according to Lighthouse. This is because it uses 3G (1.6Mbit/s download speed) settings by default.

Puppeteer and DevTools Protocol

const puppeteer = require('puppeteer');
const throughputKBs = process.env.throughput || 200;

(async () => {
  const browser = await puppeteer.launch({
    executablePath: 
      'C:\\Program Files (x86)\\Google\\Chrome\\Application\\chrome.exe',
    headless: false
  });
  const page = await browser.newPage();
  const client = await page.target().createCDPSession();

  await client.send('Network.emulateNetworkConditions', {
    offline: false,
    latency: 200,
    downloadThroughput: throughputKBs * 1024,
    uploadThroughput: throughputKBs * 1024
  });

  const start = (new Date()).getTime();
  await client.send('Page.navigate', {
    'url': 'https://automationrhapsody.com'
  });
  await page.waitForNavigation({
    timeout: 240000,
    waitUntil: 'load'
  });
  const end = (new Date()).getTime();
  const totalTimeSeconds = (end - start) / 1000;

  console.log(`Page loaded for ${totalTimeSeconds} seconds 
    when connection is ${throughputKBs}kbit/s`);

  await browser.close();
})();

In the current example, network conditions with restricted bandwidth are emulated in order to test page load time and perception. With executablePath Puppeteer launches an instance of Chrome browser. The path given in the example is for Windows machine. Then a client is made to communicate with DevTools Protocol with page.target().createCDPSession(). Configurations are send to browser with client.send(‘Network.emulateNetworkConditions’, { }). Then URL is opened into the page with client.send(‘Page.navigate’, { URL}). The script can be run with different values for throughput passed as environment variable. Example waits 240 seconds for the page to fully load with page.waitForNavigation().

Conclusion

In the current post, I have described several ways to measure the performance of your web application. The main tool used to control the browser is Puppeteer because it integrated very easily with Lighthouse and DevTools Protocol. All examples can be executed through the CLI, so they can be easily plugged into CI/CD process. Among the various approaches, you can compile your preferred scenario which can be run on every commit to measure if the performance of your application has been affected by certain code changes.

Related Posts

Read more...

MD5, SHA-1, SHA-256 and SHA-512 speed performance

Last Updated on by

Post summary: Speed performance comparison of MD5, SHA-1, SHA-256 and SHA-512 cryptographic hash functions in Java.

For Implement secure API authentication over HTTP with Dropwizard post, a one-way hash function was needed. Several factors are important when choosing hash algorithm: security, speed, and purpose of use.

Security

MD5 and SHA-1 are compromised. Those shall not be used unless their speed is several times slower than SHA-256 or SHA-512. Other that remain are SHA-256 and SHA-512. They are from SHA-2 family and are much more secure. SHA-256 is computed with 32-bit words, SHA-512 with 64-bit words.

Hash implementations

For generating cryptographic hashes in Java there is Apache Commons Codec library which is very convenient.

Speed performance

In order to test the speed sample code is used:

import java.util.UUID;

import org.apache.commons.codec.digest.DigestUtils;
import org.apache.commons.lang.time.StopWatch;

public class Test {

	private static final int TIMES = 1_000_000;
	private static final String UUID_STRING = UUID.randomUUID().toString();

	public static void main(String[] args) {
		System.out.println(generateStringToHash());
		System.out.println("MD5: " + md5());
		System.out.println("SHA-1: " + sha1());
		System.out.println("SHA-256: " + sha256());
		System.out.println("SHA-512: " + sha512());
	}

	public static long md5() {
		StopWatch watch = new StopWatch();
		watch.start();
		for (int i = 0; i < TIMES; i++) {
			DigestUtils.md5Hex(generateStringToHash());
		}
		watch.stop();
		System.out.println(DigestUtils.md5Hex(generateStringToHash()));
		return watch.getTime();
	}

	public static long sha1() {
		...
		System.out.println(DigestUtils.sha1Hex(generateStringToHash()));
		return watch.getTime();
	}

	public static long sha256() {
		...
		System.out.println(DigestUtils.sha256Hex(generateStringToHash()));
		return watch.getTime();
	}

	public static long sha512() {
		...
		System.out.println(DigestUtils.sha512Hex(generateStringToHash()));
		return watch.getTime();
	}

	public static String generateStringToHash() {
		return UUID.randomUUID().toString() + System.currentTimeMillis();
	}
}

Several measurements were done. Two groups – one with smaller length string to hash and one with longer. Each group had following variations of generateStringToHash() method:

  • cached UUID – no extra time should be consumed
  • cached UUID + current system time – in this case, time is consumed to get system time
  • new UUID + current system time – in this case, time is consumed for generating the UUID and to get system time

Raw results

Five measurements were made for each case an average value calculated. Time is in milliseconds per 1 000 000 calculations. The system is 64 bits Windows 10 with 1 core Intel i7 2.60GHz and 16GB RAM.

  • generateStringToHash() with: return UUID_STRING;

Data to encode is ~36 characters in length (f5cdcda7-d873-455f-9902-dc9c7894bee0). UUID is cached and time stamp is not taken. No additional time is wasted.

Hash #1 (ms) #2 (ms) #3 (ms) #4 (ms) #5 (ms) Average per 1M (ms)
MD5 649 623 621 624 620 627.4
SHA-1 608 588 630 600 594 604
SHA-256 746 724 741 720 758 737.8
SHA-512 1073 1055 1050 1052 1052 1056.4
  • generateStringToHash() with: return UUID_STRING + System.currentTimeMillis();

Data to encode is ~49 characters in length (aa096640-21d6-4f44-9c49-4115d3fa69381468217419114). UUID is cached.

Hash #1 (ms) #2 (ms) #3 (ms) #4 (ms) #5 (ms) Average per 1M (ms)
MD5 751 789 745 806 737 765.6
SHA-1 768 765 694 763 751 748.2
SHA-256 842 876 848 839 850 851
SHA-512 1161 1152 1164 1154 1163 1158.8
  • generateStringToHash() with: return UUID.randomUUID().toString() + System.currentTimeMillis();

Data to encode is ~49 characters in length (1af4a3e1-1d92-40e7-8a74-7bb7394211e01468216765464). New UUID is generated on each calculation so time for its generation is included in total time.

Hash #1 (ms) #2 (ms) #3 (ms) #4 (ms) #5 (ms) Average per 1M (ms)
MD5 1505  1471 1518 1463 1487 1488.8
SHA-1 1333 1309 1323 1326 1334 1325
SHA-256 1505 1496 1507 1498 1516 1504.4
SHA-512 1834 1827 1833 1836 1857 1837.4
  • generateStringToHash() with: return UUID_STRING + UUID_STRING;

Data to encode is ~72 characters in length (57149cb6-991c-4ffd-9c98-d823ee8a61f757149cb6-991c-4ffd-9c98-d823ee8a61f7). UUID is cached and time stamp is not taken. No additional time is wasted.

Hash #1 (ms) #2 (ms) #3 (ms) #4 (ms) #5 (ms) Average per 1M (ms)
MD5 856 824 876 811 828 839
SHA-1 921 896 970 904 893 916.8
SHA-256 1145 1137 1241 1141 1177 1168.2
SHA-512 1133 1131 1116 1102 1110 1118.4
  • generateStringToHash() with: return UUID_STRING + UUID_STRING + System.currentTimeMillis();

Data to encode is ~85 characters in length (759529c5-1f57-4167-b289-899c163c775e759529c5-1f57-4167-b289-899c163c775e1468218673060). UUID is cached.

Hash #1 (ms) #2 (ms) #3 (ms) #4 (ms) #5 (ms) Average per 1M (ms)
MD5 1029 1035 1034 1012 1037 1029.4
SHA-1 1008 1016 1027 1007 990 1009.6
SHA-256 1254 1249 1290 1259 1248 1260
SHA-512 1228 1221 1232 1230 1226 1227.4
  • generateStringToHash() with: final String randomUuid = UUID.randomUUID().toString();
    return randomUuid + randomUuid + System.currentTimeMillis();

Data to encode is ~85 characters in length (2734b31f-16db-4eba-afd5-121d0670ffa72734b31f-16db-4eba-afd5-121d0670ffa71468217683040). New UUID is generated on each calculation so time for its generation is included in total time.

Hash #1 (ms) #2 (ms) #3 (ms) #4 (ms) #5 (ms) Average per 1M (ms)
MD5 1753 1757 1739 1751 1691 1738.2
SHA-1 1634 1634 1627 1634 1633 1632.4
SHA-256 1962 1956 1988 1988 1924 1963.6
SHA-512 1909 1946 1936 1929 1895 1923

Aggregated results

Results from all iterations are aggregated and compared in the table below. There are 6 main cases. They are listed below and referenced in the table:

  • Case 1 – 36 characters length string, UUID is cached
  • Case 2 – 49 characters length string, UUID is cached and system time stamp is calculated each iteration
  • Case 3 – 49 characters length string, new UUID is generated on each iteration and system time stamp is calculated each iteration
  • Case 4 – 72 characters length string, UUID is cached
  • Case 5 – 85 characters length string, UUID is cached and system time stamp is calculated each iteration
  • Case 6 – 85 characters length string, new UUID is generated on each iteration and system time stamp is calculated each iteration

All times below are per 1 000 000 calculations:

Hash Case 1 (ms) Case 2 (ms) Case 3 (ms) Case 4 (ms) Case 5 (ms) Case 6 (ms)
MD5 627.4 765.6 1488.8 839 1029.4 1738.2
SHA-1 604 748.2 1325 916.8 1009.6 1632.4
SHA-256 737.8 851 1504.4 1168.2 1260 1963.6
SHA-512 1056.4 1158.8 1837.4 1118.4 1227.4 1923

Compare results

Some conclusions of the results based on two cases with short string (36 and 49 chars) and longer string (72 and 85 chars).

  • SHA-256 is faster with 31% than SHA-512 only when hashing small strings. When the string is longer SHA-512 is faster with 2.9%.
  • Time to get system time stamp is ~121.6 ms per 1M iterations.
  • Time to generate UUID is ~670.4 ms per 1M iterations.
  • SHA-1 is fastest hashing function with ~587.9 ms per 1M operations for short strings and 881.7 ms per 1M for longer strings.
  • MD5 is 7.6% slower than SHA-1 for short strings and 1.3% for longer strings.
  • SHA-256 is 15.5% slower than SHA-1 for short strings and 23.4% for longer strings.
  • SHA-512 is 51.7% slower that SHA-1 for short strings and 20% for longer.

Hash sizes

Important data to consider is hash size that is produced by each function:

  • MD5 produces 32 chars hash – 5f3a47d4c0f703c5d83265c3669f95e6
  • SHA-1 produces 40 chars hash – 2c5a70165585bd4409aedeea289628fa6074e17e
  • SHA-256 produces 64 chars hash – b6ba4d0a53ddc447b25cb32b154c47f33770d479869be794ccc94dffa1698cd0
  • SHA-512 produces 128 chars hash – 54cdb8ee95fa7264b7eca84766ecccde7fd9e3e00c8b8bf518e9fcff52ad061ad28cae49ec3a09144ee8f342666462743718b5a73215bee373ed6f3120d30351

Purpose of use

In specific case this research was made for hashed string will be passed as API request. It is constructed from API Key + Secret Key + current time in seconds. So if API Key is something like 15-20 chars, Secret Key is 10-15 chars and time is 10 chars, total length of string to hash is 35-45 chars. Since it is being passed as request param it is better to be as short as possible.

Select hash function

Based on all data so far SHA-256 is selected. It is from secure SHA-2 family. It is much faster than SHA-512 with shorter stings and it produces 64 chars hash.

Conclusion

The current post gives a comparison of MD5, SHA-1, SHA-256 and SHA-512 cryptographic hash functions. Important is that comparison is very dependant on specific implementation (Apache Commons Codec), the specific purpose of use (generate a secure token to be sent with API call). It is good MD5 and SHA-1 to be avoided as they are compromised and not secure. If their speed for given context is several times faster than secure SHA-2 ones and security is not that much important they can be chosen though. When choosing cryptographic hash function everything is up to a context of usage and benchmark tests for this context is needed.

Related Posts

Read more...

Avoid multithreading problems in Java using ThreadLocal

Last Updated on by

Post summary: What are common approaches to deal with multithreading problems in Java. What is ThreadLocal and how to use it.

Multithreading problems

By definition, multithreading is the ability of CPU to execute multiple processes and threads. Almost every application nowadays is multithreaded. This allows programs to be faster and handler more users, programs have a more complex design. Multithreading causes race conditions (performing many operations at the same time on one resource) and deadlocks (competitive actions wait for each other to finish).

Multithreading problem

See code snippet below. This is a simple utility class that converts Date to String. When functional or unit tests are executed on it there are no issues, since in most cases those are single threaded. When a performance test is run program will burst into flames. Problem is that SimpleDateFormat is not thread-safe. Java 8 date objects are thread safe as they are immutable, but Java 7 below are not:

import java.text.SimpleDateFormat;
import java.util.Date;
import java.util.Locale;

public final class DateTimeUtils {

	private static final SimpleDateFormat DATE_FORMAT
			= new SimpleDateFormat("yyyy-MM-dd", Locale.ENGLISH);

	private DateTimeUtils() {
		// Util class
	}

	public static String toDateString(Date date) {
		return DATE_FORMAT.format(date);
	}
}

Avoid multithreading problems

Debugging multithreading problems is really hard. During debug, there are no race conditions and program works correctly. The program can even work correctly with a small number of users. One clue for multithreading problems is NullPointerException in places in a code where it is impossible to have such. Prevention is better than debugging. Prevention suggests proper design. Below is a list of approaches how to prevent and avoid multithreading issues:

  • Immutable objects
  • Defensive copies
  • Synchronized
  • Volatile
  • Atomic operations
  • ThreadLocal

Immutable objects

Immutable means something that cannot change. Values in such objects are initialized once and never changed, just read. Date objects in Java 8 are immutable which makes them safe to use. Object below is an example of immutable one:

public class Immutable {

	private String name;

	public Immutable(String name) {
		this.name = name;
	}

	public String getName() {
		return name;
	}
}

Going back to the initial problem with DateTimeUtils one solution could be to always create new SimpleDateFormat object:

public static String toDateString(Date date) {
	return new SimpleDateFormat("yyyy-MM-dd", Locale.ENGLISH).format(date);
}

Defensive copies

Immutable objects are really simple and their fields should be primitive data types, which is not always possible. If some field is an object (List) then the getter will return a copy of the reference to this object, but the actual object can be still manipulated in heap. In such cases defensive copies are returned:

import java.util.ArrayList;
import java.util.Collections;
import java.util.List;

public class Immutable {

	private String name;
	private List<String> hobbies;

	public Immutable(String name, String... hobbies) {
		this.name = name;
		this.hobbies = new ArrayList<>();
		Collections.addAll(this.hobbies, hobbies);
	}

	public String getName() {
		return name;
	}

	public List<String> getHobbies() {
		return new ArrayList<>(hobbies);
	}
}

The example here works as ArrayList is from String. If it was from some Object only references would be copied from one list to other, again real object would be available in heap, so deep copy of the Object data is also needed. Copy should drill down to the primitive types.

Synchronized

Synchronized methods cannot be accessed from two thread at the same time. One thread can access the synchronized object method, others are blocked and wait. Another solution to DateTimeUtils problem could be using synchronized:

private static final SimpleDateFormat DATE_FORMAT
            = new SimpleDateFormat("yyyy-MM-dd", Locale.ENGLISH);

public static synchronized String toDateString(Date date) {
	return DATE_FORMAT.format(date);
}

Theoretically, this should work and when testing locally it does, but I’ve seen this solution not working in real life application, so I would not go for synchronized in given problem context.

Volatile

Volatile means that variable is stored in main memory. I would not go into details about this solution. It is pretty complex and has unexpected problems.

Atomic operations

The Java language specification guarantees that reading or writing a variable is an atomic operation (unless the variable is of type long or double because of some CPU architecture specifics). For example, i++ is not an atomic operation, it consists of two operations – read the value and add 1 to it. In order to be sure you use atomic operations on variables, Java provides a whole package with atomic objects java.util.concurrent.atomic. Objects have methods like getAndSet(), getAndIncrement() and getAndDecrement() which ensure thread safety.

ThreadLocal

This was the topic initially blog post was about, but with the research, it got little extended. This class provides thread-local variables or in other words variables that are actually different for each and every thread. It is little strange because declaration suggests this is one variable but Java makes copies behind the scenes. There is also InheritableThreadLocal which means the variable is different for other threads, but one and the same for the current thread and its sub-threads. This could also lead to multithreading problems if you mess the thread-local object from the sub-threads. The third solution to DateTimeUtils problem could be:

private static final ThreadLocal<SimpleDateFormat> DATE_FORMAT
		= new ThreadLocal<SimpleDateFormat>() {
	@Override
	protected SimpleDateFormat initialValue() {
		return new SimpleDateFormat("yyyy-MM-dd", Locale.ENGLISH);
	}
};

public static String toDateString(Date date) {
	return DATE_FORMAT.get().format(date);
}

Or using new Java 8 lambda expressions code will look as below. More on Java 8 features can be found in Java 8 features – Lambda expressions, Interface changes, Stream API, DateTime API post.

private static final ThreadLocal<SimpleDateFormat> DATE_FORMAT_SAFE = ThreadLocal
	.withInitial(() -> new SimpleDateFormat("yyyy-MM-dd", Locale.ENGLISH));

public static String toDateString(Date date) {
	return DATE_FORMAT.get().format(date);
}

Comparison of solutions to multithreading problem

I have given three solutions to DateTimeUtils multithreading problem. Code shown above is available in GitHub java-samples/junit repository. There is unit test DateTimeUtilsTest which is run in multithreading mode with Maven Surefire Plugin and tests the solutions. 10 tests are run in 10 separate threads. Each test makes 1000 invocations of toDateString() method with unique date. Java 8 LocalDate is used in tests to confirm thread safety. Here are thoughts and time for different solutions:

  • synchronized (toDateStringSynchronized) – time to execute tests is 0.091 – 0.101s. I would not go for this solution as I stated above I’ve seen it not working in real life application. Also just theoretically since threads have to wait on each other performance will suffer.
  • new object on each method call (toDateStringNewObject) – time to execute tests is 0.114 – 0.124s. Object creation could be expensive operation. In this case there are 10000 objects created, compared to 1 in synchronized version and 10 in ThreadLocal version.
  • ThreadLocal (toDateStringThreadLocal) – time to execute tests is 0.75 – 0.82s. This is my favourite. There is no wait on threads and very low amount of objects are created.

Observations above are valid for given multithreading problem, not a general rule. Everything is up to the problem that needs to be solved.

Conclusion

Multithreading is a very advanced topic. In this post, I have just given some overview and examples that could be easily applied in automation code. I would encourage you to use ThreadLocal to prevent multithreading problems. In production code, things could be much more complex. Very good tutorial on multithreading can be found in Java Concurrency / Multithreading Tutorial.

Related Posts

Read more...

Performance testing with Gatling – reports

Last Updated on by

Post summary: Some details on Gatling results report.

Current post is part of Performance testing with Gatling series in which Gatling performance testing tool is explained in details.

If you have followed the Gatling series so far you should know how to record a simulation, what simulation consists of, how to create Maven project and make code well structured and maintainable. Now is the time to run that code and see the results.

Gatling global information

Gatling has a pretty cool looking report. It shows global information about simulation as long as more detailed information for each request or request group. This is how the global information looks like:

Gatling-reports-global

Shown above is just part of global information report page. There are following sections on it:

  • Indicators – distribution in specified response time intervals: less than 800ms, 800ms – 1200ms, more 1200ms and failed. This can give you a general overview of the system performance. If the highest percentage of the responses are less than 800ms this is quite good performance indication.
  • Number of requests – pie chart showing different request types. This gives visual information how many requests of different type are being sent. Type is actually the request name defined in http() method.
  • STATISTICS – table with very detailed information what count of each request type has been sent, OK, KO count, KO percentage. There is information what is the best, worst and mean time for each request type. Since worst time could be for a single response this is not quite informative. This is why there is grouping what is the response time for 95% and 99% of the responses. Last information requests per second.
  • Active Users along the Simulation – how many virtual users were sending requests at each moment during the simulation. There is also user count per scenario. The scenario is identified by its name defined in scenario() method.
  • Response Time Distribution – detailed responses distribution in small time intervals. Pretty similar to Indicators one, but much more detailed, as time intervals are very small. This gives a much better perspective of performance as you can see what percentage of the requests are in given time bucket. This graphic also includes error requests as well.
  • Response Time Percentiles over Time (OK) – minimum and maximum request time at each moment during simulation only for successful (OK) requests. There is also request grouping into percentage values showing what percent of the requests take given amount of time. Similar to STATISTICS table, but here there is much more detailed grouping and also you can see it distributed during simulation execution. Additionally, this graphic shows the number of user at each moment during simulation.
  • Number of requests per second – how many requests are done to the server at each moment during simulation. There is separate graphics for all requests, OK and KO requests. Additionally, this graphic shows the number of user at each moment during simulation.
  • Number of responses per second – how many responses are done to the server at each moment during simulation. There is separate graphics for all responses, OK and KO responses. Additionally, this graphic shows the number of user at each moment during simulation.

Gatling request details

Apart from the global information, there is a detailed report for each request type. Requests are sorted by name, used when defining the HTTP request in http() method. This is how request details look like:

Gatling-reports-details

Shown above is just part of the request details report page. There are following sections on it:

  • Indicators – same as in global information
  • STATISTICS – same as in global information but just timing for this particular request are shown.
  • Response Time Distribution – same as in global information
  • Response Time Percentiles over Time (OK) – same as in global information
  • Latency Percentiles over Time (OK) – same as Response Time Percentiles over Time (OK), but showing the time needed for the server to process the request, although it is incorrectly called latency. By definition Latency + Process Time = Response time. So this graphic is supposed to give the time needed for a request to reach the server. Checking real-life graphics I think this graphic shows not the Latency, but the real Process Time. You can get an idea of the real Latency by taking one and the same second from Response Time Percentiles over Time (OK) and subtract values from current graphs for the same second.
  • Number of requests per second – same as in global information
  • Number of responses per second – same as in global information
  • Response Time against Global RPS – distribution of current request’s response time related to total request per second of the simulation.
  • Latency against Global RPS – distribution of current request’s latency (process time) related to total request per second of the simulation.

Gatling data in simulation.log file

As you will see in the previous two sections Gatling gathers a limited amount of data, how many requests are made per any given time of the execution, are the responses OK or KO, what time each request and response take. All this information is stored into simulation.log file. Although the file is plain text data in it is understandable only by Gatling. In Performance testing with Gatling – advanced usage post, it is shown how you can extract more details from request and response. This gets recorded in simulation.log file, so be careful when doing this as this file might get enormous. View sample simulation.log file or sample Gatling report.

Conclusion

Gatling report is a valuable source of information to read the performance data by providing some details about requests and responses timing. The report should not be your main tool for finding issues when doing performance testing though. It is a good idea to have a server monitoring tool that gives more precise information about memory consumption and CPU. In case of bottlenecks identified by Gatling, it is mandatory to do some profiling of the application to understand what action on the server takes the longest time.

Related Posts

Read more...

Performance testing with Gatling – advanced usage

Last Updated on by

Post summary: Code samples and explanation how to do advanced performance testing with Gatling, such as proper scenarios structure, checks, feeding test data, session maintenance, etc.

Current post is part of Performance testing with Gatling series in which Gatling performance testing tool is explained in details.

Code samples are available in GitHub sample-performance-with-gatling repository.

In previous post Performance testing with Gatling – integration with Maven there is description how to setup Maven project. In Performance testing with Gatling – recorded simulation explanation there is information what a simulation consists of. Simulations from this post will be refactored in current post and more advanced topics will be discussed how to make flexible automation testing with Gatling.

What is included

Following topics are included in the current post:

  • Access external configuration data
  • Define single HTTP requests for better re-usability
  • Add checks for content on HTTP response
  • Check and extract data from HTTP response
  • More checks and extract List with values
  • Create HTTP POST request with the body from a template file
  • Manage session variables
  • Standard CSV feeder
  • Create custom feeder
  • Create unified scenarios
  • Conditional scenario execution
  • Only one HTTP protocol
  • Extract data from HTTP request and response
  • Advanced simulation setUp
  • Virtual users vs requests per second

Refactored code

Below are all classes that are created after they have been refactored. In order to separate things and make it easier to read ProductSimulation and PersonSimulation classes contain only the setUp() method. Request, scenarios and external configurations are being defined into Constants, Product and Person singleton objects.

Constants

object Constants {
	val numberOfUsers: Int = System.getProperty("numberOfUsers").toInt
	val duration: FiniteDuration = System.getProperty("durationMinutes").toInt.minutes
	val pause: FiniteDuration = System.getProperty("pauseBetweenRequestsMs").toInt.millisecond
	val responseTimeMs = 500
	val responseSuccessPercentage = 99
	private val url: String = System.getProperty("url")
	private val repeatTimes: Int = System.getProperty("numberOfRepetitions").toInt
	private val successStatus: Int = 200
	private val isDebug = System.getProperty("debug").toBoolean

	val httpProtocol = http
		.baseURL(url)
		.check(status.is(successStatus))
		.extraInfoExtractor { extraInfo => List(getExtraInfo(extraInfo)) }

	def createScenario(name: String, feed: FeederBuilder[_], chains: ChainBuilder*): ScenarioBuilder = {
		if (Constants.repeatTimes > 0) {
			scenario(name).feed(feed).repeat(Constants.repeatTimes) {
				exec(chains).pause(Constants.pause)
			}
		} else {
			scenario(name).feed(feed).forever() {
				exec(chains).pause(Constants.pause)
			}
		}
	}

	private def getExtraInfo(extraInfo: ExtraInfo): String = {
		if (isDebug
			|| extraInfo.response.statusCode.get != successStatus
			|| extraInfo.status.eq(Status.apply("KO"))) {
			",URL:" + extraInfo.request.getUrl +
				" Request: " + extraInfo.request.getStringData +
				" Response: " + extraInfo.response.body.string
		} else {
			""
		}
	}
}

Product

object Product {

	private val reqGoToHome = exec(http("Open home page")
		.get("/products")
		.check(regex("Search: "))
	)

	private val reqSearchProduct = exec(http("Search product")
		.get("/products?q=${search_term}&action=search-results")
		.check(regex("Your search for '${search_term}' gave ([\\d]{1,2}) results:").saveAs("numberOfProducts"))
		.check(regex("NotFound").optional.saveAs("not_found"))
	)

	private val reqOpenProduct = exec(session => {
		var numberOfProducts = session("numberOfProducts").as[String].toInt
		var productId = Random.nextInt(numberOfProducts) + 1
		session.set("productId", productId)
	}).exec(http("Open Product")
		.get("/products?action=details&id=${productId}")
		.check(regex("This is 'Product ${productId} name' details page."))
	)
	
	private val csvFeeder = csv("search_terms.csv").circular.random

	val scnSearch = Constants.createScenario("Search", csvFeeder,
		reqGoToHome, reqSearchProduct, reqGoToHome)

	val scnSearchAndOpen = Constants.createScenario("Search and Open", csvFeeder,
		reqGoToHome, reqSearchProduct, reqOpenProduct, reqGoToHome)
}

ProductSimulation

class ProductSimulation extends Simulation {

	setUp(
		Product.scnSearch.inject(rampUsers(Constants.numberOfUsers) over 10.seconds),
		Product.scnSearchAndOpen.inject(atOnceUsers(Constants.numberOfUsers))
	)
		.protocols(Constants.httpProtocol.inferHtmlResources())
		.pauses(constantPauses)
		.maxDuration(Constants.duration)
		.assertions(
			global.responseTime.max.lessThan(Constants.responseTimeMs),
			global.successfulRequests.percent.greaterThan(Constants.responseSuccessPercentage)
		)
}

Person

object Person {

	private val added = "Added"
	private val updated = "Updated"

	private val reqGetAll = exec(http("Get All Persons")
		.get("/person/all")
		.check(regex("\"firstName\":\"(.*?)\"").count.greaterThan(1).saveAs("count"))
		.check(regex("\\[").count.is(1))
		.check(regex("\"id\":([\\d]{1,6})").findAll.saveAs("person_ids"))
	).exec(session => {
		val count = session("count").as[Int]
		val personIds = session("person_ids").as[List[Int]]
		val personId = personIds(Random.nextInt(count)).toString.toInt
		session.set("person_id", personId)
	}).exec(session => {
		println(session)
		session
	})

	private val reqGetPerson = exec(http("Get Person")
		.get("/person/get/${person_id}")
		.check(regex("\"firstName\":\"(.*?)\"").count.is(1))
		.check(regex("\\[").notExists)
	)

	private val reqSavePerson = exec(http("Save Person")
		.post("/person/save")
		.body(ElFileBody("person.json"))
		.header("Content-Type", "application/json")
		.check(regex("Person with id=([\\d]{1,6})").saveAs("person_id"))
		.check(regex("\\[").notExists)
		.check(regex("(" + added + "|" + updated + ") Person with id=").saveAs("action"))
	)

	private val reqGetPersonAferSave = exec(http("Get Person After Save")
		.get("/person/get/${person_id}")
		.check(regex("\"id\":${person_id}"))
		.check(regex("\"firstName\":\"${first_name}\""))
		.check(regex("\"lastName\":\"${last_name}\""))
		.check(regex("\"email\":\"${email}\""))
	)

	private val reqGetPersonAferUpdate = exec(http("Get Person After Update")
		.get("/person/get/${person_id}")
		.check(regex("\"id\":${person_id}"))
	)

	private val uniqueIds: List[String] = Source
		.fromInputStream(getClass.getResourceAsStream("/account_ids.txt"))
		.getLines().toList

	private val feedSearchTerms = Iterator.continually(buildFeeder(uniqueIds))

	private def buildFeeder(dataList: List[String]): Map[String, Any] = {
		Map(
			"id" -> (Random.nextInt(100) + 1),
			"first_name" -> Random.alphanumeric.take(5).mkString,
			"last_name" -> Random.alphanumeric.take(5).mkString,
			"email" -> Random.alphanumeric.take(5).mkString.concat("@na.na"),
			"unique_id" -> dataList(Random.nextInt(dataList.size))
		)
	}

	val scnGet = Constants.createScenario("Get all then one", feedSearchTerms,
		reqGetAll, reqGetPerson)

	val scnSaveAndGet = Constants.createScenario("Save and get", feedSearchTerms, reqSavePerson)
		.doIfEqualsOrElse("${action}", added) {
			reqGetPersonAferSave
		} {
			reqGetPersonAferUpdate
		}
}

PersonSimulation

class PersonSimulation extends Simulation {

	setUp(
		Person.scnGet.inject(atOnceUsers(Constants.numberOfUsers)),
		Person.scnSaveAndGet.inject(atOnceUsers(Constants.numberOfUsers))
	)
		.protocols(Constants.httpProtocol)
		.pauses(constantPauses)
		.maxDuration(Constants.duration)
		.assertions(
			global.responseTime.max.lessThan(Constants.responseTimeMs),
			global.successfulRequests.percent.greaterThan(Constants.responseSuccessPercentage)
		)
}

Access external configuration data

In order to have flexibility it is mandatory to be able to sent different configurations parameters from command line when invoking the scenario. With Gatling Maven plugin it is done with  configurations. See more in Performance testing with Gatling – integration with Maven post.

val numberOfUsers: Int = System.getProperty("numberOfUsers").toInt
val duration: FiniteDuration = System.getProperty("durationMinutes").toInt.minutes
private val url: String = System.getProperty("url")
private val repeatTimes: Int = System.getProperty("numberOfRepetitions").toInt
private val isDebug = System.getProperty("debug").toBoolean

Define single HTTP requests for better re-usability

It is a good idea to define each HTTP request as a separate object. This gives the flexibility to reuse one and the same requests in different scenarios. Below is shown how to create HTTP GET request with http().get().

Add checks for content on HTTP response

On HTTP request creation there is a possibility to add checks that certain string or regular expression pattern exists in response. The code below created HTTP Request and add check that “Search: “ text exists in response. This is done with regex() method by passing just a string to it.

private val reqGoToHome = exec(http("Open home page")
	.get("/products")
	.check(regex("Search: "))
)

Check and extract data from HTTP response

It is possible along with the check to extract data into a variable that is being saved to the session. This is done with saveAs() method. In some cases value we are searching for, might not be in the response. We can use optional method to specify that value is saved in session only if existing. If it is not existing it won’t be captured and this will not break the execution. As shown below session variables can be also used in the checks. Session variable is accessed with ${},  such as ${search_term}.

private val reqSearchProduct = exec(http("Search product")
	.get("/products?q=${search_term}&action=search-results")
	.check(regex("Your search for '${search_term}' gave ([\\d]{1,2}) results:")
		.saveAs("numberOfProducts"))
	.check(regex("NotFound").optional.saveAs("not_found"))
)

More checks and extract List with values

There are many types of checks. In code below count.greaterThan(1) and count.is(1) are used. It is possible to search for multiple occurrences of given regular expression with findAll. In such case saveAs() saves the results to a “person_ids” List object in session. More information about checks can be found in Gatling Checks page.

private val reqGetAll = exec(http("Get All Persons")
	.get("/person/all")
	.check(regex("\"firstName\":\"(.*?)\"").count.greaterThan(1).saveAs("count"))
	.check(regex("\\[").count.is(1))
	.check(regex("\"id\":([\\d]{1,6})").findAll.saveAs("person_ids"))
)

Create HTTP POST request with the body from a template file

If you need to post data to server HTTP POST request is to be used. The request is created with http().post() method. Headers can be added to the request with header() or headers() methods. In the current example, without Content-Type=application/json header REST service will throw an error for unrecognized content. Data that will be sent is added in body() method. It accepts Body object. You can generate body from a file (RawFileBody method) or string (StringBody method).

private val reqSavePerson = exec(http("Save Person")
	.post("/person/save")
	.body(ElFileBody("person.json"))
	.header("Content-Type", "application/json")
	.check(regex("Person with id=([\\d]{1,6})").saveAs("person_id"))
	.check(regex("\\[").notExists)
	.check(regex("(" + added + "|" + updated + ") Person with id=")
		.saveAs("action"))
)

In current case body is generated from file, which have variables that can be later on found in session. This is done with ElFileBody (ELFileBody in 2.0.0) method and actual replace with value is done by Gatling EL (expression language). More about what can you do with EL can be found on Gatling EL page. EL body file is shown below, where variables ${id}, ${first_name}, ${last_name} ${email} are searched in session and replaced if found. If not found error is shown on scenario execution output.

{
	"id": "${id}",
	"firstName": "${first_name}",
	"lastName": "${last_name}",
	"email": "${email}"
}

Manage session variables

Each virtual user has its own session. The scenario can store or read data from the session. Data is saved in session with key/value pairs, where the key is the variable name. Variables are stored in session in three ways: using feeders (this is explained later in the current post), using saveAs() method and session API. More details on session API can be found in Gatling Session API page.

Manipulating session through API is kind of tricky. Gatling documentation is vague about it. Below is shown a code where session variable is extracted first as String and then converted to Int with: var numberOfProducts = session(“numberOfProducts”).as[String].toInt. On next step some manipulation is done with this variable, in current case, a random product id from 1 to “numberOfProducts” to is picked. At last a new variable is saved in session with session.set(“productId”, productId). It is important that this is the last line of session manipulation code block done in first exec(). This is the return statement of the code block. In other words, new Session object with saved “productId” in it is returned. If on the last line is just “session” as stated in the docs, then old, an unmodified session object is returned without variable being added.

Sessions as most of the objects in Gatling and in Scala are immutable. This is designed for thread safety. So adding a variable to session actually creates a new object. This is why newly added session variable cannot be used in the same exec() block, but have to be used on next one, as in same block variable is yet not accessible. See code below in the second exec() “productId” is already available and can be used in get().

private val reqOpenProduct = exec(session => {
	var numberOfProducts = session("numberOfProducts").as[String].toInt
	var productId = Random.nextInt(numberOfProducts) + 1
	session.set("productId", productId)
}).exec(http("Open Product")
	.get("/products?action=details&id=${productId}")
	.check(regex("This is 'Product ${productId} name' details page."))
)

Same logic being explained above is implemented in next code fragment. The below example shows usage of session variable saved in previous exec() fragment. Count of persons and List with ids are being saved by saveAs() method. The list is extracted from the session and random index of it has been accessed, so random person is being selected. This is again saved into session as “person_id”. In third exec() statement “session” object is just printed to output for debugging purposes.

private val reqGetAll = exec(http("Get All Persons")
	.get("/person/all")
	.check(regex("\"firstName\":\"(.*?)\"").count.greaterThan(1).saveAs("count"))
	.check(regex("\\[").count.is(1))
	.check(regex("\"id\":([\\d]{1,6})").findAll.saveAs("person_ids"))
).exec(session => {
	val count = session("count").as[Int]
	val personIds = session("person_ids").as[List[Int]]
	val personId = personIds(Random.nextInt(count)).toString.toInt
	session.set("person_id", personId)
}).exec(session => {
	println(session)
	session
})

Standard CSV feeder

A feeder is a way to generate unique data for each virtual user. This how tests are made real. Below is a way to read data from CSV file. The first line of the CSV file is the header which is saved to the session as a variable name. In the current example, CSV has only one column, but it is possible to have CSV file with several columns. circular means that if file end is reached feeder will start from the beginning. random means elements are taken in random order. More about feeders can be found in Gatling Feeders page.

private val csvFeeder = csv("search_terms.csv").circular.random

Create custom feeder

Feeder actually is Iterator[Map[String, T]], so you can do your own feeders. Below is shown code where some unique ids are read from file and converted to List[String] with Source .fromInputStream(getClass.getResourceAsStream(“/account_ids.txt”)) .getLines().toList. This list is used in buildFeeder() method to access random element from it. Finally Iterator.continually(buildFeeder(uniqueIds)) creates infinite length iterator.

private val uniqueIds: List[String] = Source
	.fromInputStream(getClass.getResourceAsStream("/account_ids.txt"))
	.getLines().toList

private val feedSearchTerms = Iterator.continually(buildFeeder(uniqueIds))

private def buildFeeder(dataList: List[String]): Map[String, Any] = {
	Map(
		"id" -> (Random.nextInt(100) + 1),
		"first_name" -> Random.alphanumeric.take(5).mkString,
		"last_name" -> Random.alphanumeric.take(5).mkString,
		"email" -> Random.alphanumeric.take(5).mkString.concat("@na.na"),
		"unique_id" -> dataList(Random.nextInt(dataList.size))
	)
}

The current business case doesn’t make much sense to have a custom feeder with values from a file, just Map() generator is enough. But let us imagine a case where you search for a hotel by unique id and some date in the future. Hard coding date in CSV file is not a wise solution, you will want to be always in the future. Also making different combinations from hotelId, start and end dates is not possible to be maintained in a file. The best solution is to have a file with hotel ids and dates to be dynamically generated as shown in buildFeeder() method.

Create unified scenarios

The scenario is created from HTTP requests. This is why it is good to have each HTTP request as a separate object so you can reuse them in different scenarios. In order to unify scenario creation, there is a special method. It takes scenario name, feeder and list of requests and returns a scenario object. Method checks if the scenario is supposed to be repeated several times and uses repeat() method. Else scenarios are repeated forever(). In both cases, there is constant pause time introduced between requests with pause().

def createScenario(name: String, 
					feed: FeederBuilder[_],
					chains: ChainBuilder*): ScenarioBuilder = {
	if (Constants.repeatTimes > 0) {
		scenario(name).feed(feed).repeat(Constants.repeatTimes) {
			exec(chains).pause(Constants.pause)
		}
	} else {
		scenario(name).feed(feed).forever() {
			exec(chains).pause(Constants.pause)
		}
	}
}

With this approach, a method can be reused from many places avoiding duplication of code.

val scnSearch = Constants.createScenario("Search", csvFeeder,
		reqGoToHome, reqSearchProduct, reqGoToHome)

Conditional scenario execution

It is possible one scenario to have different execution paths based on a condition. This condition is generally a value of a session variable. Branching is done with doIf, doIfElse, doIfEqualsOrElse, etc methods. In the current example, if this is Save request then additional reqGetPersonAferSave HTTP request is executed. Else additional reqGetPersonAferUpdate HTTP request is executed. In the end, there is only one scenario scnSaveAndGet but it can have different execution paths based on “action” session variable.

val scnSaveAndGet = Constants
	.createScenario("Save and get", feedSearchTerms, reqSavePerson)
	.doIfEqualsOrElse("${action}", added) {
		reqGetPersonAferSave
	} {
		reqGetPersonAferUpdate
	}

Only one HTTP protocol

In general case, several performance testing simulations can be done for one and the same application. During simulation setUp an HTTP protocol object is needed. Since the application is the same HTTP protocol can be one and the same object, so it is possible to define it and reuse it. If changes are needed new HTTP protocol object can be defined or a copy of current one can be created and modified.

val httpProtocol = http
	.baseURL(url)
	.check(status.is(successStatus))
	.extraInfoExtractor { extraInfo => List(getExtraInfo(extraInfo)) }

Extract data from HTTP request and response

In order to ease debugging of failures or debugging at all, it is possible to extract information from HTTP request and response. Extraction is configured on HTTP protocol level with extraInfoExtractor { extraInfo => List(getExtraInfo(extraInfo)) } as shown above. In order to simplify code processing of extra info object is done in a separate method. If debug is enabled or response code is not 200 or Gatling status is KO then request URL, request data and response body are dumped into simulation.log file that resides in results folder. Note that response body is extracted only if there is check on it, otherwise, there is NoResponseBody in the output. This is done to improve performance.

private def getExtraInfo(extraInfo: ExtraInfo): String = {
	if (isDebug
		|| extraInfo.response.statusCode.get != successStatus
		|| extraInfo.status.eq(Status.apply("KO"))) {
		",URL:" + extraInfo.request.getUrl +
			" Request: " + extraInfo.request.getStringData +
			" Response: " + extraInfo.response.body.string
	} else {
		""
	}
}

Advanced simulation setUp

It is a good idea to keep simulation class clean by defining all objects in external classes or singleton objects. Simulation is mandatory to have setUp() method. It receives a comma-separated list of scenarios. In order scenario to be valid, it should have users injected with inject() method. There are different strategies to inject users. The protocol should also be defined per scenario setup. In this particular example default protocol is used with the change to fetch all HTTP resources on a page (JS, CSS, images, etc.) with inferHtmlResources(). Since objects are immutable this creates a copy of default HTTP protocol and does not modify the original one. Assertions is a way to verify certain performance KPI it is defined with assertions() method. In this example, we should have a response time less than 500ms and more than 99% of requests should be successful.

private val rampUpTime: FiniteDuration = 10.seconds

setUp(
	Product.scnSearch.inject(rampUsers(Constants.numberOfUsers) over rampUpTime),
	Product.scnSearchAndOpen.inject(atOnceUsers(Constants.numberOfUsers))
)
	.protocols(Constants.httpProtocol.inferHtmlResources())
	.pauses(constantPauses)
	.maxDuration(Constants.duration)
	.assertions(
		global.responseTime.max.lessThan(Constants.responseTimeMs),
		global.successfulRequests.percent
			.greaterThan(Constants.responseSuccessPercentage)
	)
	.throttle(reachRps(100) in rampUpTime, holdFor(Constants.duration))

Cookies management

Cookie support is enabled by default and then Gatling handles Cookies transparently, just like a browser would. It is possible to add or delete cookies during the simulation run. See more details how this is done in Gatling Cookie management page.

Virtual users vs requests per second

Since users are vague metric, but requests per second is metric that most server monitoring tools support it is possible to use this approach. Gatling supports so-called throttling: throttle(reachRps(100) in 10.seconds, holdFor(5.minutes)). It is important to put holdFor() method, otherwise, Gatling goes to unlimited requests per second and can crash the server. More details on simulation setup can be found on Gatling Simulation setup page.

Conclusion

Keeping Gatling code maintainable and reusable is a good practice to create complex performance scenarios. Gatling API provides a wide range of functionalities to support this task. In the current post, I have shown cases and solution to them which I have encountered in real life projects.

Related Posts

Read more...

Performance testing with Gatling – integration with Maven

Last Updated on by

Post summary: Code samples and explanation how to create performance testing project with Gatling and Maven and run it with Maven plugin.

Current post is part of Performance testing with Gatling series in which Gatling performance testing tool is explained in details.

Code samples are available in GitHub sample-performance-with-gatling repository.

Add Maven dependencies

The first step is to create Maven project and add corresponding dependencies to pom.xml file. Only needed is to gatling-charts-highcharts in order to be able to have access to Galling libraries:

<dependencies>
	<dependency>
		<groupId>io.gatling.highcharts</groupId>
		<artifactId>gatling-charts-highcharts</artifactId>
		<version>2.0.0</version>
	</dependency>
</dependencies>

In GitHub, code version is configured as property for an easy change.

Add Maven plugins

Once dependency to Gatling is added then plugin references should be added. One is for Scala Maven plugin used for compiling/testing/running/documenting Scala code in Maven. Another plugin is Gatling Maven plugin used for running the performance test scenarios:

<build>
	<plugins>
		<plugin>
			<groupId>net.alchim31.maven</groupId>
			<artifactId>scala-maven-plugin</artifactId>
			<version>3.2.2</version>
		</plugin>
		<plugin>
			<groupId>io.gatling</groupId>
			<artifactId>gatling-maven-plugin</artifactId>
			<version>2.0.0</version>
			<configuration>
				<jvmArgs>
					<jvmArg>-Durl=http://localhost:9000</jvmArg>
					<jvmArg>-DnumberOfUsers=10</jvmArg>
					<jvmArg>-DnumberOfRepetitions=1</jvmArg>
					<jvmArg>-DdurationMinutes=1</jvmArg>
					<jvmArg>-DpauseBetweenRequestsMs=3000</jvmArg>
					<jvmArg>-Ddebug=true</jvmArg>
				</jvmArgs>
			</configuration>
		</plugin>
	</plugins>
</build>

Read configurations from Gatling Maven plugin

In order to make it easy to configure several parameters are being passed as jvmArgs, this makes it very easy to run the tests with different configurations. Those are read in code as Java system property:

val numberOfUsers: Int = System.getProperty("numberOfUsers").toInt
val duration: FiniteDuration = System.getProperty("durationMinutes").toInt.minutes
private val url: String = System.getProperty("url")
private val repeatTimes: Int = System.getProperty("numberOfRepetitions").toInt
private val isDebug = System.getProperty("debug").toBoolean

Gatling Maven plugin defaults

By default Gatling Maven plugin uses following default paths, so they do not need to be explicitly provided:

<configuration>
	<configFolder>src/test/resources</configFolder>
	<dataFolder>src/test/resources/data</dataFolder>
	<resultsFolder>target/gatling/results</resultsFolder>
	<bodiesFolder>src/test/resources/bodies</bodiesFolder>
	<simulationsFolder>src/test/scala</simulationsFolder>
</configuration>

Record simulation

Description how to record simulation can be found in Performance testing with Gatling – record and playback post. Once the simulation is recorded it can be modified and added to Maven project. More details of what a recorded simulation consists of can be found in Performance testing with Gatling – recorded simulation explanation post.

Running simulation

Gatling simulations are run with the mvn gatling:execute command. The important part is to provide which is the simulation class to be run. One is to use a <simulationClass> configuration in pom.xml, other and more flexible is to give it in mvn command: mvn gatling:execute -Dgatling.simulationClass={FULL_PATH_TO_SIMULATION_CLASS}, example is: mvn gatling:execute -Dgatling.simulationClass=com.automationrhapsody.gatling.simulations.original.ProductSimulation

Change default configuration

Default Gatling configuration can be seen in their GitHub: gatling-defaults.conf. If you need to change those when using Gatling with Maven there are two possible options:

Change with a file

In order to change default configuration with a file, you have to create a file similar to gatling-defaults.conf but name it gatling.conf. Leave in the file only the configuration that you want to change. Below is a file that makes Gatling not to produce any reports.

gatling {
  charting {
    noReports = true
  }
}

This file should be put into configFolder property of gatling-maven-plugin config in pom.xml. By default, this is: src/test/resources, but you can change the default as well.

Change with a system property

You can change some Gatling property for this particular run. This is done by adding Java system property into the run command. For the example above, you need to add -Dgatling.charting.noReports=true and now Gatling will not produce reports for this run. Both file and Java system property can be used, but system property is with higher priority. Note that if you have to provide property from core config node, you have to skip core. It is -Dgatling.simulationClass, not -Dgatling.core.simulationClass.

Conclusion

Usage of Gatling with Maven is very convenient and the proper way to do it. Still recorded simulation should be modified before usage. How to modify in order to make it easier to maintain and how to use advanced Gatling features is shown in next post Performance testing with Gatling – advanced usage.

Related Posts

Read more...

Performance testing with Gatling – recorded simulation explanation

Last Updated on by

Post summary: Explanation of automatically generated code of recorded Gatling simulations.

Current post is part of Performance testing with Gatling series in which Gatling performance testing tool is explained in details.

Code samples are available in GitHub sample-performance-with-gatling repository.

Application under test

For current tutorial application from Build a RESTful stub server with Dropwizard post is used. It is a pretty simple application. One feature is Products web application where you can search for products, open one and see its details. The other features used in this post is Persons REST service, where you can get or save person via JSON.

Record simulation

Coding simulations from scratch can be difficult and tricky, so it is always a good idea to record the scenario and then modify it. How to record can be found in Performance testing with Gatling – record and playback post. The recording that was done on the application under test for current tutorial produced following simulation files, which can be found in com.automationrhapsody.gatling.simulations.original package of GitHub project. There are two simulations being recorded. ProductSimulation which tests web application and PersonSImulation testing REST service.

ProductSimulation explained

Below is a recorded code for product simulation:

package com.automationrhapsody.gatling.simulations.original

import io.gatling.core.Predef._
import io.gatling.http.Predef._

class ProductSimulation extends Simulation {

	val httpProtocol = http
		.baseURL("http://localhost:9000")
		.inferHtmlResources()


	val uri1 = "http://localhost:9000/products"

	val scn = scenario("RecordedSimulation")
		.exec(http("request_0")
			.get("/products"))
		.pause(11)
		.exec(http("request_1")
			.get("/products?q=SearchString&action=search-results"))
		.pause(8)
		.exec(http("request_2")
			.get("/products?action=details&id=1"))
		.pause(6)
		.exec(http("request_3")
			.get("/products"))

	setUp(scn.inject(atOnceUsers(1))).protocols(httpProtocol)
}

Simulation is performing following steps:

  • Open /products URI on http://localhost:9000 URL.
  • Wait 11 seconds.
  • Search for “SearchString”.
  • Wait 8 seconds.
  • Open product with id=1 from search results.
  • Wait 6 seconds.
  • Go to home page – /products

With val httpProtocol = http .baseURL(“http://localhost:9000”) .inferHtmlResources() an object of HTTP Protocol is instantiated. URL is configured with baseURL(). All related HTML resources are being captured with any request with inferHtmlResources(). This method allow more precise filtering what resources to be fetched and which skipped. See more in Gatling HTTP Protocol page.

Variable uri1 is defined but is not actually used anywhere, so it is redundant.

A scenario is defined with scenario(“RecordedSimulation”), this method accepts the name of the scenario, “RecordedSimulation” in the current case. A scenario is a building block of a simulation. One simulation should have at least one scenario. See more about scenarios on Gatling Scenario page.

With exec() method are added actual actions to get executed. In most of the cases, the action is an HTTP GET or POST request. In current example GET request is done with http(“request_0”) .get(“/products”), where “request_0” is the name of the HTTP Request. A name is used to identify request in the results file. So it is good to have a unique name for different requests. The “/products” is the URI GET request will open. See more about HTTP requests on Gatling HTTP Request page.

Once scenario and protocol have been defined those need to be assembled into a Simulation. Simulation class should extend Gatling’s io.gatling.core.Simulation class. This gives access to setUp() method which is configuring the simulation. setUp method takes a scenario with injected users in it scn.inject(atOnceUsers(1)). In this case, one used is injected at simulation start. There are different inject patterns that can be used. More about simulations setup can be found in Gatling Simulation setup page.

PersonSimulation explained

Below is recorded code for person simulation:

package com.automationrhapsody.gatling.simulations.original

import io.gatling.core.Predef._
import io.gatling.http.Predef._

class PersonSimulation extends Simulation {

	val httpProtocol = http
		.baseURL("http://localhost:9000")
		.inferHtmlResources()

	val headers_0 = Map(
		"Accept" -> "text/html,application/xhtml+xml,application/xml",
		"Upgrade-Insecure-Requests" -> "1")

	val headers_1 = Map(
		"Origin" -> "chrome-extension://fhbjgbiflinjbdggehcddcbncdddomop",
		"Postman-Token" -> "9577054e-c4a3-117f-74ab-e84a2be473e0")

	val headers_2 = Map(
		"Origin" -> "chrome-extension://fhbjgbiflinjbdggehcddcbncdddomop",
		"Postman-Token" -> "639b36ea-aff3-1b85-618e-c696734afc6e")

	val uri1 = "http://localhost:9000/person"

	val scn = scenario("RecordedSimulation")
		.exec(http("request_0")
			.get("/person/all")
			.headers(headers_0))
		.pause(9)
		.exec(http("request_1")
			.post("/person/save")
			.headers(headers_1)
			.body(RawFileBody("RecordedSimulation_0001_request.txt")))
		.pause(3)
		.exec(http("request_2")
			.post("/person/save")
			.headers(headers_2)
			.body(RawFileBody("RecordedSimulation_0002_request.txt")))

	setUp(scn.inject(atOnceUsers(1))).protocols(httpProtocol)
}

In short, scenario is following:

  • Invoke /person/all REST service on http://localhost:9000 URL.
  • Wait 9 seconds.
  • Save person by POST request to /person/save and RecordedSimulation_0001_request.txt JSON body.
  • Wait 3 seconds.
  • Save again person by POST request to /person/save and RecordedSimulation_0002_request.txt JSON body.

Most of the code here is similar to the one in PersonSimulation, so will not go over it again. Difference is the http(“request_1”) .post(“/person/save”) .headers(headers_1) .body(RawFileBody(“RecordedSimulation_0001_request.txt”)) code. It creates HTTP request with name “request_1”. Here request is POST to “/person/save” URI. POST data is put in the body by body() method, it loads “RecordedSimulation_0001_request.txt” file by reading it directly with RawFileBody() method. In many cases this is not convenient at all, it should be possible to parameterize the request and fill it with test data. This is done with ELFileBody() method.

If you have paid attention to all the readings here and to GitHub project you may have noticed that Gatling Maven plugin defaults say: <bodiesFolder>src/test/resources/bodies</bodiesFolder>, but the request is actually in src/test/resources folder of the project.

Conclusion

Recording scenario is a good way to get started but those needs to be refactored for efficiency and better maintenance. In order to be able to modify the first step is to understand what has been recorded. Once recordings are done those will be incorporated into Maven build. This is shown in Performance testing with Gatling – integration with Maven and Performance testing with Gatling – advanced usage posts.

Related Posts

Read more...

Performance testing with Gatling – Scala fundamentals

Last Updated on by

Post summary: Tutorial that covers basic Scala functionalities that may be needed during Gatling automation.

Current post is part of Performance testing with Gatling series in which Gatling performance testing tool is explained in details.

You need to have basic Java knowledge as this tutorial in most of the cases compares Scala with Java.

General concepts

In order to use Scala, its compiler needs to be installed from Scala home page. Scala source code is compiled to Java Byte Code and is run on Java Virtual Machine.

Scala is an object-oriented functional programming language. Everything in Scala is an object. There are no primitive types as in Java, those are represented by objects. Even functions are also objects.

There is very good interoperability with Java and Java code can be used inside Scala. Java object from Java classes can be created, also static methods in Java classes can be called.

Syntax

Scala syntax is pretty much the same as in Java. Although Scala is statically typed (checks are done at compile time) in most of the cases you do not need to explicitly specify variable type, Scala compiler knows it.

Scala is case-sensitive, class names are CamelCase with the first letter being capital, method names are also camel case starting with a lower case letter.

Semicolon “;” is not mandatory at the end of the line is it has only one expression. In case of more expressions on one line then is mandatory to separate each expression with a semicolon.

Classes and packages

The class file name should be with the same name as the class itself.

Import all classes from a package is done with an underscore:

import io.gatling.core.Predef._

Import of several classes from a package is done with curly brackets:

import org.joda.time.format.{DateTimeFormat, DateTimeFormatter}

Data types

As stated above everything is Scala is an object. There are no primitive types. Those are represented by objects:

  • Byte – 8 bit signed value. Range from -128 to 127
  • Short – 16 bit signed value. Range -32768 to 32767
  • Int – 32 bit signed value. Range -2147483648 to 2147483647
  • Long – 64 bit signed value. -9223372036854775808 to 9223372036854775807
  • Float – 32 bit IEEE 754 single-precision float
  • Double – 64 bit IEEE 754 double-precision float
  • Char – 16 bit unsigned Unicode character. Range from U+0000 to U+FFFF
  • String – a sequence of Chars
  • Boolean – either the literal true or the literal false
  • Unit – corresponds to no value
  • Null – null or empty reference
  • Nothing – the subtype of every other type; includes no values
  • Any – the supertype of any type; any object is of type Any
  • AnyRef – the supertype of any reference type

Strings and Arrays

Strings and arrays are very similar to Java ones. In Scala is possible to define multi-line string literal. This is done with three quotes: “””This is text

split into two lines”””

Variables

Variable declaration is done with the following format:

val or val VariableName : DataType [= Initial Value]

Example is: var answer : Int = 42. This is the full declaration. In most cases you do not need to provide data type, so above can be shortened to: var answer = 42.

With var you define a variable that is going to change its value. On the other hand, val keyword is used for defining variables that will never change, constants, like final in Java.

Access modifiers

Access modifiers are public, private and protected. There is no explicit keyword public though. If no modifier is used then access level is considered public.

private and protected can be defined for a specific scope.

private[com.automationrhpasody.gatling]

In the example above, field, method or class that this modifier is applied to is considered private for all the world, except for classes in package com.automationrhpasody.gatling. The scope can be a single class or singleton object (more about those will follow).

Operators

Operators are very similar to Java. Those are:

  • Arithmetic Operators (+, -, *, /, %)
  • Relational Operators (==, !=, >, <, >=, <=)
  • Logical Operators (&&, |, !)
  • Bitwise Operators (&, |, ^, ~, <<, >>, >>>)
  • Assignment Operators (=, +=, -=, *=, /=, %=, <<=, >>=, &=, ^=, |=)

Unlike Java there are no ++ and — operators. This is because everything in Scala is object and default data types are immutable objects. So modifications on current object are not possible, new object is created instead, so it is not possible to have ++ and — operations.

Conditional statements

A conditional statement is if/else same as in Java:

if (condition) {
	statement
}

if (condition) {
	statement1
} else {
	statement2
}

if (condition1) {
	statement1
} else if (condition2) {
	statement2
} else {
	statement3
}

Loop statements

Loop statements are for, while, do/while. For statement is very specific, the easiest way to use it is with Ranges:

for (i <- 1 until 10) {
	println("i=" + i)
}

The code above will print values from 1 to 9. Operator <- is called generator as it generating the individual values from the range. 1 until 10 is the actual range. This is the number from 1 to 9, 10 is not included. If you want the last value included use to: 1 to 10.

It is possible to put some conditional statement in the for loop with if clause:

for (i <- 1 until 10; if i >= 3 && i <= 6) {
	println("i=" + i)
}

The code above will print values 3, 4, 5 and 6. Only those are >= 3 and <= 6 from the whole range.

Nested for loops are pretty easy in Scala and not that apparent, so it is easy to get into performance issues:

for (i <- 1 until 5; j <- 1 to 3) {
	println("i=" + i)
	println("j=" + j)
}

The code above is equal to Java code:

for (int i = 0; i < 5; i++) {
	for (int j = 0; j <= 3; j++) {
		System.out.println("i=" + i);
		System.out.println("j=" + j);
	}
}

For loop can also be used with collections:

val daysOfWeek = List("Mon", "Tue", "Wed", "Thu", "Fri", "Sat", "Sun")
for (str <- daysOfWeek) {
	println("day=" + str);
}

You can also iterate Java collections, but first, they need to be converted by classes in scala.collection.JavaConversions package. Below is example iterating Java’s System Properties:

import scala.collection.JavaConversions._

for (key <- System.getProperties.keySet().iterator.toIterator) {
	println("Key=" + key + ", Value=" + System.getProperty(key.toString))
}

Loop statements while and do/while as in Java:

while (condition) {
	statement
}

do {
	statement
} while (condition)

Methods and functions

Scala has both functions and methods. This is a group of statements and conditions that perform a task and can return a result. Difference between those is that method can be defined only inside a class. A function can be defined anywhere in the code. This is an object that can be assigned to a variable. Functions and method names in Scala can contain special characters such as +, -, &, ~, etc.

A function definition is:

def functionName ([list of parameters]) : [return type] = {
	function body
	[return] [expr]
}

Data in [] are optional. The return type is any valid Scala type. If nothing is to be returned then Unit is returned, this is as void methods in Java. As you can notice even return statement, in the end, is not mandatory and can be omitted, then the function will return the statement that comes last.

def sum(a: Int, b: Int): Int = {
	a + b
}

Function/method above sums two Integer values and returns the result of the sum.

A function is called the same way as in Java:

[object.]functionName([list of parameters])

Scala is function based language, so there are many many things that can be done with functions. More you can read on Scala functions in Tutorialspoint.

Collections

A collection is a group of objects. Scala API has a rich set of collections. By default collections in Scala are immutable. This means current collection object cannot be changed, if you do some change on a collection this results in the creation of new collection with desired changes applied in it. This is made for thread safety. There are also mutable collections. They can be found in scala.collection.mutable package.

  • Lists – lists are very similar to arrays, you have elements in sequential order that can be accessed.
  • Sets – collection of unique elements, there are no duplicates.
  • Maps – a collection of key/value pairs. Values are retrieved based on their unique key.
  • Tuples – combines several elements together so they can be considered one object.
  • Iterators – not actually a collection, but a way to access elements from a collection one by one.

More about Scala collections can be found in Scala collections in Tutorialspoint.

Classes, objects

A class is a blueprint for objects. A class is like a cookie cutter. Objects are the cookies. Objects are created with keyword new. A class name is a class constructor taking different arguments. You can pass parameters to it. A class can have several constructors. The restriction is that each constructor should call on its first line some other constructor. Eventually, the main constructor in the class name will get called. Classes can be extended similarly to Java.

class Car(isStarted: Boolean) {
	var _isStarted: Boolean = isStarted
	var _speed: Int = 0

	def this() = this(true)

	def start(): Unit = {
		_isStarted = true
		println("Car is started: " + _isStarted)
	}

	def drive(speed: Int): Unit = {
		_speed = speed
		if (_isStarted) {
			println("Car moving with speed: " + _speed)
		} else {
			println("Car is not started!")
		}
	}
}

Singleton objects

In Scala, there is no definition of static methods or fields. In order to accomplish similar functionality, you can use singleton objects, classes with only one instance defined with object keyword.

object UseThatCar {
	def main(args: Array[String]) {
		val car1 = new Car(false)
		car1.drive(50)

		val car2 = new Car()
		car2.drive(45)
	}
}

Resources

I do not tend to be Scala expert. I know little but enough to make Gatling performance testing. So I have used other network resources to build this post. A very good tutorial is Scala in Tutorialspoint. Another interesting post is The 10 Most Annoying Things Coming Back to Java After Some Days of Scala.

Conclusion

People that have worked with Scala really love it. It is made for performance and scalability. Because everything is object and default types are immutable objects Scala is much more thread safe than Java. Functions can be defined anywhere and do everything you want, so you can do almost everything with just functions if you like. Although it is that good Scala is compiled to Byte Code and run on Java Virtual Machine, so limitations applicable to JVM are applicable to Scala executable code. No matter if you like it or not, you have to learn basics of Scala as Gatling is written in Scala and in order to do performance testing with it you have to know Scala fundamentals.

Related Posts

Read more...

Performance testing with Gatling – record and playback

Last Updated on by

Post summary: How to record a simulation with Gatling recorder and play it back.

Current post is part of Performance testing with Gatling series in which Gatling performance testing tool is explained in details.

Run the recorder

Once Gatling is downloaded recorder can be run with “GATLING_HOME\bin\recorder.bat”. The recorder has two working modes: HTTP Proxy and HAR Converter.

Gatling-recorder-HTTP

Configure browser proxy

Network traffic should be redirected through Gatling Recorder in order to be captured in HTTP Proxy mode. By default, recorder works on 8000 port, but this is configurable. If a web application is being tested then the browser should be configured to work through the Gatling Recorder proxy. Firefox is configured from Tools -> Options -> Advanced -> Network -> Settings… -> Manual proxy configurations: -> localhost with Port: 8000, Use this proxy server for all protocols.

Gatling-set-proxy-Firefox

Microsoft Edge browser has also specific configurations for setting a proxy: Settings -> Network & Internet -> Proxy -> Manual proxy setup.

Gatling-set-system-proxy

Configure system proxy

If network traffic that is going to be recorded is not browser-based, e.g. REST or SOAP call, then system-wide proxy should be configured. For Windows this is done through Control Panel -> Internet Options-> Connections -> LAN Settings -> Use a proxy server for your LAN. This configuration forces applications network traffic to go through a configured proxy. The same configuration is done in order to configure a proxy for Chrome, Opera and Internet Explorer browsers.

Use Gatling Recorder’s HTTP Proxy

Once a proxy is configured then “Start” button runs the Gatling Recorder proxy and opens a new window that shows all requests being captured. “Stop & Save” button stops the proxy and saves all requests that went through into a Gatling simulation file. The image below is a screenshot of recording of testing RESTful stub server built in Build a RESTful stub server with Dropwizard post which will be used for testing purposes in these tutorial series.

Gatling-recorded

HTTPS and Gatling Recorder

HTTPS is HTTP over SSL or TLS security layer. It is designed to bring security in normal HTTP communication. This security is guaranteed with the server being issues certificate issued by a certification authority. Gatling is intercepting the traffic between server and client (browser) hence is considered intruder into safe HTTPS communications. There are several mechanisms provided by the recorder to handle this. Those are handled in HTTPS modes configuration. The easiest to use is “Self-signed Certificate”. In this mode Gatling is using a certificate which is not issued for web application being tested, hence browsers are recognizing it as invalid. Browsers give warning that certificate is invalid and asks for user’s permission to continue. Beware: in normal daily internet browsing such warning is a sign that something is wrong, your HTTPS connection might be sniffed, so be careful what data you provide in such cases. Some sites are configured in a manner that if the certificate is invalid you are unable to proceed. Here is how Firefox react in both cases. When there is a possibility to continue there is “Add Exception…” button.

Gatling-Firefox-SSL-error

Other options to handle certificate problem is “Provided Keystore” and “Certificate Authority” HTTPS mode. For both valid certificate should be issued for the domain under test. More details how to do this can be found Gatling Recorder page.

In case traffic that has to be captured is not browser-based tools that are used to simulate requests should provide support for handling missing valid certificates in case of “Self-signed Certificate”. If you custom code that sends SOAP is being written then Send SOAP request over HTTPS without valid certificates post describes how to work without valid certificates. This can be applied also in case of RESTful HTTPS call.

Use Gatling Recorder’s HAR Converter

Generating and handling SSL certificates could be a painful process. Before diving into it, another option, that is good to be considered is using Gatling Recorder in HAR Converter mode. In order to do this, all network traffic should be recorded as HTTP Archive – HAR. This can easily be done with Chrome DevTools plugin that is activated with F12 keyboard key. Remember to select “Preserve log” checkbox before starting to record test scenario. Once the scenario is recorded it can be exported with a right mouse click and then “Save as HAR with content”.

Gatling-capture-traffic-HAR

Beware: sensitive data such as passwords are also exported as plain text in HAR archive. Once traffic is being recorded and exported it then gets converted to Gatling simulation by Gatling Recorder. In order to exclude not important requests, e.g. images, CSS, JS, call to other domains there is Blacklist that accepts Java regular expressions. It is possible to use default list by clicking “No static resource” button. There is also Whitelist that can accept only needed requests.

Gatling-recorder-HAR

Running recorded scenario

Gatling Recorder saves scenarios in the directory configured in “Output folder*”. By default it uses “GATLING_HOME\user-files\simulations” folder. Simulations are run with “GATLING_HOME\bin\gatling.bat”. Once started is looks default simulations folder and gives a list of all simulations. The user selects simulation by number in the list and then gives a short description for this run. Simulations can be changed before running in order to configure a different number of users as it is 1 by default. If simulations are recorded in different that default folder then runner cannot find them. In such case one option is to move them to “GATLING_HOME\user-files\simulations” or:

Use non-default simulations folder

In order to use differently than default simulation’s folder then this should be configured in “GATLING_HOME\conf\gatling.conf” file. Following configuration elements hierarchy: gatling -> core -> directory -> simulations = “C:\\Gatling\\simulations”.

Conclusion

Gatling recorder is powerful and provides various ways to record a scenario. Either by capturing network traffic in HTTP Proxy mode or by importing already captured network traffic in HAR Converter mode.

Related Posts

Read more...

Performance testing with Gatling

Last Updated on by

Post summary: Tutorial how to use Gatling and do successful performance testing with it.

This is first of series of posts designed to give a complete overview of Gatling performance testing tool. Other posts in the series are:

Performance testing

Performance testing is a way to identify how an application behaves in case of high user load. In this post “performance testing” is used as a collective term but it actually has different aspects which are described in Performance, Load, Stress and Soak testing post. The essence and best practices of performance testing are described in How to do proper performance testing post. Current post is about how to do it with Gatling

Gatling

Gatling is a very powerful tool. Build on top of Akka it enables thousands of virtual users on a single machine. Akka has message-driven architecture and this overrides the JVM limitation of handling many threads. Virtual users are not threads but messages. Tests are written in Scala, which makes scenarios creation and maintenance more complex.

Gatling Recorder

For easy scenario creation, Gatling provides very good recorder. It works as a proxy capturing all traffic and converting it into Gatling scenario. Detailed explanation how to record scenario can be found in Performance testing with Gatling – record and playback post.

Run simulation

Once a simulation is recorded it can be changed with proper values, user count, etc and run. How to run a simulation can be found at the end of Performance testing with Gatling – record and playback post.

Gatling terminology

“Simulation” is the actual test. It is a Scala class that extends Gatling’s io.gatling.core.scenario.Simulation class. Simulation has an HTTP Protocol object instantiated and configured with proper values as URL, request header parameters, authentication, caching, etc. Simulation has one or more “Scenario”. A scenario is a series of HTTP Requests with a different action (POST/GET) and request parameters. The scenario is the actual user execution path. It is configured with load users count and a ramp-up pattern. This is done in the Simulation’s “setUp” method. Several scenarios can form one simulation. There are other elements like Feeders that create input data and Checks that are used to validate responses. Those will be discussed in Performance testing with Gatling – recorded simulation explanation post.

REST and SOAP

REST and SOAP are also easily supported by Gatling since in they are very nature they are just HTTP requests. SOAP is HTTP POST request with XML data put into request body. It is possible to have some special HTTP Headers in the request but in general case this is it. REST is either HTTP GET request with key/value params in the URI or HTTP POST request with JSON or XML data into request body. There are also HTTP Header parameters in the request to indicate the data type being sent, etc.

Scala

Scala is object-oriented language and functional programming language, providing best of both worlds. Everything in Scala is an object, there are no primitive data types like int, long, char, etc in Java. More simple Scala tutorial can be found in Performance testing with Gatling – Scala fundamentals post.

Advanced Gatling

In order to properly edit simulation, it should be included in a project and imported in some IDE. Gatling provides a Gatling Maven plugin. There are more plugins to be used they can be found on Gatling extensions page. Simulation can be recorded with the recorder and further processed as a Maven project. Information with examples how this can be done is shown in Performance testing with Gatling – integration with Maven and Performance testing with Gatling – advanced usage posts.

Conclusion

Gatling is very good performance testing tool. It is capable of creating an immense amount of traffic from a single node. It requires basic knowledge in Scala which is his main disadvantage. Java code can be directly used in Scala classes. Advance usage is from a Maven project which makes it more easy to use and maintain scenarios.

Related Posts

Read more...

Performance, Load, Stress and Soak testing

Last Updated on by

Post summary: Performance, Load, Stress and Soak testing are different aspects of one goal – proving that application will function correctly with a large number of users.

Previously I have written for non-functionally testing the application in conditions of a large number of users in How to do proper performance testing post. There I’m using only one term performance testing. If we have to be precise there are several different types of testing that can be done to achieve the goal of sustaining a large number of users.

Performance testing

Testing the system to find out how fast is the system. Create a benchmark of system response times and stability under particular user load. Response time should be small enough to keep users satisfied.

Load testing

Testing how the system performs when it is loaded with its expected amount of users. The load can be slightly increased to measure if and how performance degrades. Load and performance testing are tied together. System performance depends on the load applied to it. Load testing should prove that in case of expected and peak users load system performs close to benchmarks measured with a small load.

Stress testing

Testing of the system beyond its normal expected amount of users to observe its behavior. Sometimes the system is loaded until its crash. The idea behind this testing is to understand how the system handles errors and data when it is highly loaded, is data preserved correctly, what load can crash the system, what happens when the system crashes.

Soak testing

This is kind of underestimated but it is rather important. Soak testing is to test the system with expected or little more than the expected load for a long amount of time. The idea behind that is system may respond fast during short tests but actually to hide some memory leak which will become obvious after a long amount of time.

Knowledge is power

Knowing the problems helps to prepare for them. Procedures can be prepared and followed to avoid a system crash. In case there is a module identified to be slow but important for business it can be made configurable and can be turned down in case of a higher load. In case users count have reached a critical level that could endanger the system, support can reject some users. In case of memory leaks, support can restart the system at regular intervals in time of a low load to avoid a crash. All those and many more can be done only if we know the system.

Conclusion

There are different techniques to prove that system can handle the number of users expected by business. I like the term performance testing and use it to combine all the types of testing above. It is not that important to know the precise definition of the terms than to know what is good to be done in order to prove system can handle a large number of users or to identify the bottlenecks in case it cannot.

Related Posts

Read more...

REST performance problems with Dropwizard and Jersey JAXB provider

Last Updated on by

Post summary: Dropwizard’s performance highly degrades when using REST with XML caused by Jersey’s Abstract JAXB provider. Solution is to inject your own JAXB provider.

Dropwizard is a Java-based framework for building a RESTful web server in very short time. I have created a short tutorial how to do so in Build a RESTful stub server with Dropwizard post.

Short overview

The current application is a Dropwizard based serving as a hub between several systems. Running on Java 7, it receives REST with XML and sends XML over REST to other services. JAXB is a framework for converting XML document to Java objects and vice versa. In order to do so, JAXB needs to instantiate a context for each and every Java object. Context creation is an expensive operation.

Problem

Jersey’s Abstract JAXB provider has weak references to JAXB contexts by using WeakHashMap. This causes context’s map to be garbage collected very often and new contexts to be added again to that map. Both garbage collection and context creation are expensive operations causing 100% CPU load and very poor performance.

Solution

The solution is to create your own JAXB context provider which keeps context forever. One approach is HashMap with context created on the fly on first access of specific Java object:

import javax.ws.rs.ext.ContextResolver;
import javax.xml.bind.JAXBContext;
import javax.xml.bind.JAXBException;
import java.util.HashMap;
import java.util.Map;

public class CustomJAXBContextProvider implements ContextResolver<JAXBContext> {
	private static final Map<Class, JAXBContext> JAXB_CONTEXT
			= new HashMap<Class, JAXBContext>();

	public JAXBContext getContext(Class<?> type) {
		try {
			JAXBContext context = JAXB_CONTEXT.get(type);
			if (context == null) {
				context = JAXBContext.newInstance(type);
				JAXB_CONTEXT.put(type, context);
			}
			return context;
		} catch (JAXBException e) {
			// Do something
			return null;
		}
	}
}

Another approach is one big context created for all the Java objects from specific packages separated with a colon:

import javax.ws.rs.ext.ContextResolver;
import javax.xml.bind.JAXBContext;
import javax.xml.bind.JAXBException;

public class CustomJAXBContextProvider implements ContextResolver<JAXBContext> {
	private static JAXBContext jaxbContext;

	public JAXBContext getContext(Class<?> type) {
		try {
			if (jaxbContext == null) {
				jaxbContext = JAXBContext
						.newInstance("com.acme.foo:com.acme.bar");
			}
			return jaxbContext;
		} catch (JAXBException e) {
			// Do something
			return null;
		}
	}
}

Both approaches have pros and cons. The first approach has fast startup time, but the first request will be slow. The second approach will have a fast first request, but slow server startup time. Once JAXB context is created in Dropwizard Application class a Jersey client should be created with this context and used for REST requests:

Client client = new JerseyClientBuilder(environment)
		.using(configuration.getJerseyClientConfiguration())
		.withProvider(CustomJAXBContextProvider.class).build(getName());

Conclusion

There is no practical need to garbage collect JAXB context so it should stay as long as application lives. This is why custom JAXB provider is a good solution even there are not actual performance issues.

Related Posts

Read more...

How to do proper performance testing

Last Updated on by

Post summary: Describe what actions are needed in order to make successful performance testing.

Functional testing that system works as per user requirements is a must for every application. But if the application is expected to handle a large number of users then doing a performance testing is also an important task. Performance testing has different aspects like load, stress, soak. More about them can be found in Performance, Load, Stress and Soak testing post. Those are all incorporated into term “performance testing” in the current article. Steps to achieve successful performance testing in short are:

  1. Set proper goals
  2. Choose tools
  3. Try the tools
  4. Implement scenarios
  5. Prepare environments
  6. Run and measure

Why?

Performance testing should not be something we do for fun or because other people do it. Performance testing should be business justified. It is up to the business to decide whether performance testing will have some ROI or not. In this article, I will give a recipe on how to do performance testing.

Setting the goal

This is one of the most important steps before starting any performance initiative. Just making a performance for the sake of making performance is worthless and a waste of effort. Before starting any activity it should be clear how many users are expected, what is the peak load, what users are doing on the site and many more. This information usually is obtained from business and product owners, but it could be obtained by certain statistical data. After having rough numbers then define what answers performance test should give. Questions could be:

  • Can the system handle 100 simultaneous users with response time less than 1 second and no error?
  • Can the system handle 50 requests/second with response time less than 1.5 seconds for 1 hour and no more than 98% errors?
  • Can system work 2 days with 50 simultaneous users with response time less than 2 seconds?
  • How the system behaves with 1000 users? With 5000 users?
  • When will the system crash?
  • What is the slowest module of the system?

Choosing the tools

Choosing the tool must be done after the estimated load has been defined. There are many commercial and non-commercial tools out there. Some can produce huge traffic and cost lots of money, some can produce mediocre traffic and are free. Important criteria for choosing a tool are how many virtual users it can support and can it fulfill performance goal. Another important thing is can QAs be able to work with it and create scenarios. In the current post, I will mention two open source tools JMeter and Gatling.

JMeter

It is a well known and proven tool. It is very easy to work with, no programming skills are needed. No need to spend many words on their benefits, they are many. Problems though are that it has certain limitations on the load it may produce from a single instance. Virtual users are represented as Java thread and JVM is not good at handling too many threads. A good thing is it provides a mechanism for adding more hosts that participate in the run and can produce huge load. Management of those machines is needed. Also, there are services in the cloud that offer running JMeter test plans and you can scale up there.

Gatling

Very powerful tool. Build on top of Akka it enables thousands of virtual users on a single machine. Akka has message-driven architecture and this overrides the JVM limitation of handling many threads. Virtual users are not threads but messages. The disadvantage is that tests are written in Scala, which makes scenarios creation and maintenance more complex.

Try the tools

Do not just rely on marketing data provided on the website of the given tool. An absolute must is to record user scenarios and play them with a significant number of users. Try to make it as realistic as possible. Even if this evaluation cost more time, just spend it, it will save a lot of time and money in the long run. This evaluation will give you confidence that the tool can do the job and can be used by QAs responsible for the performance testing project.

Implement the scenarios

Some of the work should have already been done during the evaluation demo. Scenarios now must be polished to make them match real user experience as much as possible. It is a good idea to be able to implement a mechanism for changing scenarios just by a configuration.

The essence of performance testing

In terms of Web or API (REST, SOAP) performance testing every tool, no matter how fancy it is, in the end, does one and the same, send HTTP requests to the server, collects and measures the response. This is it, not rocket science.

Include static resources or not?

This is an important question in the case of Web performance testing. There is no fixed recipe though. Successful web applications use a content delivery network (CDN) to serve static content such as images, CSS, JavaScripts, media. If CDN is a third party and they provide some service level agreements (SLAs) for response time then static data should be skipped in the performance test. If it is our CDN then it may be a good idea to make separate performance testing project just for CDN itself. This could double the effort but will make each project focused and coherent. If static data is hosted on the same server as dynamic content then it may be a good idea to include images also. It very much depends on the situation. Browsers do have a cache but it is controlled by correct HTTP response header values. In case of incorrect such or too dynamic static content, this can put a significant load on the server.

Virtual users vs. requests/second

Tools for performance testing use virtual users as the main metric. This is a representation of a real-life user. With sleep times between requests, they mimic real user behavior on the application and this gives very close to reality simulation. The metric though is more business orientated. A more technical metric is a requests per second. This is what most traffic monitoring tools report. But converting between those is a tricky task. It really depends on how the application is performing. Will try to illustrate it with some examples. Let us consider 100 users with a sleep time of 1 second between requests. This theoretically should give 100 requests per second load. But if the application is responding more slowly than 1 second then it will produce fewer req/s as each user has to wait for the response and then sent next request. Lest consider 10 users with no sleep time. If the application responds for 100 ms then each user will make 10 req/s this sums to a total of 100 req/s. If the application responds with 1 second then the load will drop to 10 req/s. If the application responds with 2 seconds then the load will drop to 5 req/s. In reality, it takes several attempts to match users count with expected request per second and all those depend on the application’s response time.

Environments

With the start of the project, tests can be run on test servers or local QA/Dev machines. Sometimes problems are caught even at this level. Especially when performance testing is a big event in the company I recommend first do it locally, this could save some embarrassment. Also, this helps polish even better the scenarios. Ones everything is working perfectly locally then we can start with actual performance testing. Environments to be used for performance testing should be production like. The closer they are, the better. Once everything is good at the production-like server the cherry on top will be if tests can be run on production in times of no usage. Beware when running the tests and you try to see at what amount of users system will fail, as your test/production machine could be VM and this may affect other important VMs.

Measure

Each performance testing tool gives some reporting about response times, the total number of requests, request per second, responses with errors. This is good, but do not trust these reports. Performance testing tools like any software have bugs. You should definitely have some server monitoring software or application performance measurement tool installed on the machine under test. Those tools will give you the most adequate information as long as memory usage statistics and even hints where problems may occur.

Conclusion

Performance testing is an important part of an application life-cycle. It should be done correctly to get good results. Once you have optimized the backend and end results are not satisfactory it is time to do some measurements in the frontend as well. I have given some tips in Performance testing in the browser post.

Related Posts

Read more...