Post summary: Instrument Selenium tests with OpenTelemetry and be able to custom trace the tests themselves.
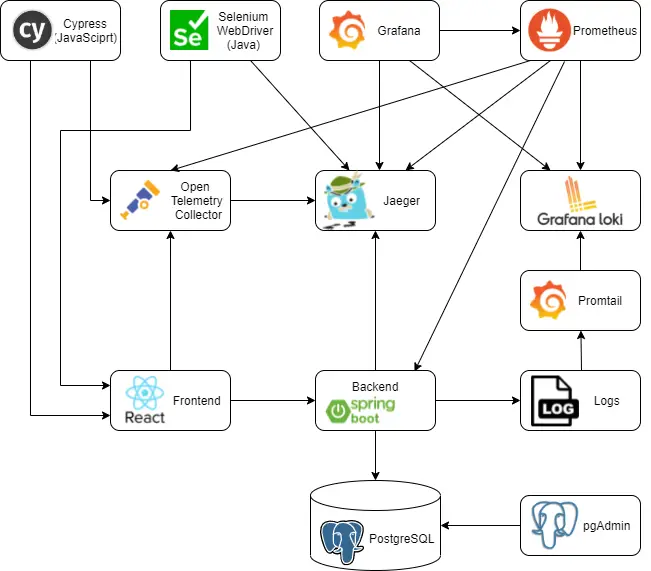
This post is part of Distributed system observability: complete end-to-end example series. The code used for this series of blog posts is located in selenium-observability-java GitHub repository.
Selenium
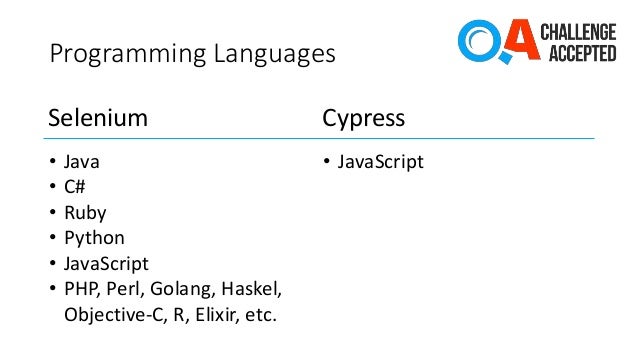
Selenium is browser automation software. It’s been around for many years and is de-facto the tool for web automation testing. It has bindings in all popular programming languages, which means people can write web automation tests in those languages.
Selenium observability
Selenium 4 comes with a pack of features. One of those features is the Selenium observability feature. It uses OpenTracing to keep track of the request’s lifecycle. This feature was the main driving factor for me to start to research the current examples. I pictured in my head end-to-end observability, from the test action down to the database call. I have to come up with a custom tracing solution, that is described in this post.
Selenium WebDriver architecture
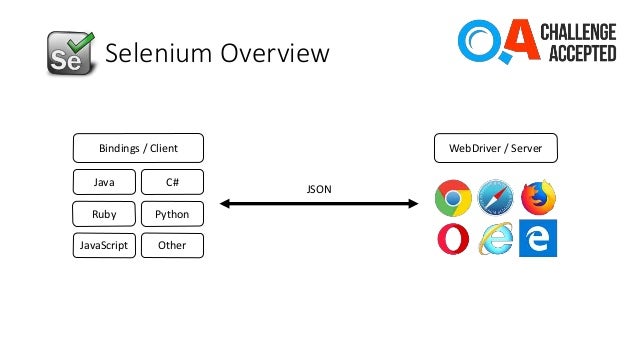
Selenium consist of a client, those are the bindings and server, these are the executables that control the given browser. Both communicate via HTTP calls with JSON payload. This is described in detail in the W3C Selenium specification. I attach a small diagram, I used in a presentation I did a long time ago.
Selenium client instrumentation
Enabling the default selenium observability is very easy. A Jar dependency has to be added in pom.xml, environment variables to be set, and of course running Jaeger instance to collect the traces. Note that this works only for the RemoteWebDriver. It is described in detail in Remote WebDriver.
<dependency>
    <groupId>io.opentelemetry</groupId>
    <artifactId>opentelemetry-exporter-jaeger</artifactId>
    <version>1.6.0</version>
</dependency>
<dependency>
    <groupId>io.grpc</groupId>
    <artifactId>grpc-netty</artifactId>
    <version>1.41.0</version>
</dependency>
This goes along with the WebDriver instantiation code.
System.setProperty("otel.traces.exporter", "jaeger");
System.setProperty("otel.exporter.jaeger.endpoint", "http://localhost:14250");
System.setProperty("otel.resource.attributes", "service.name=selenium-java-client");
System.setProperty("otel.metrics.exporter", "none");
WebDriver driver = new RemoteWebDriver(
                new URL("http://localhost:4444"),
                new ImmutableCapabilities("browserName", "chrome"));
Selenium server instrumentation
Server instrumentation examples are shown in manoj9788/tracing-selenium-grid. Both the standalone server and Selenium grid can be instrumented. In the current examples, I am working only with the standalone server. Unlike the examples, I used Docker to do the instrumentation. I take the default selenium/standalone-chrome:4.0.0 image and install Coursier, a dependency resolver tool, on top of it. Then I run the dependency fetch, so this build sted gets cached for a faster rebuild. Selenium provides –ext flag, which can be set after the standalone command option. I could not make this work only by changing the SE_OPTS environment variable, so I made this rewrite of the startup command in /opt/bin/start-selenium-standalone.sh file. What I did was to change from java -jar to java -cp command, as -cp flag is ignored in case -jar flag is used.
FROM selenium/standalone-chrome:4.0.0

# Install coursier in order to fetch the dependencies
RUN cd /tmp && curl -k -fLo cs https://git.io/coursier-cli-"$(uname | tr LD ld)" && chmod +x cs && ./cs install cs && rm cs

# Download dependencies, so they are availble during run
RUN /home/seluser/.local/share/coursier/bin/cs fetch -p io.opentelemetry:opentelemetry-exporter-jaeger:1.6.0 io.grpc:grpc-netty:1.41.0

# Modify the run command to include dependent JARs in it
RUN sudo sed -i 's~-jar /opt/selenium/selenium-server.jar~-cp "/opt/selenium/selenium-server.jar:$(/home/seluser/.local/share/coursier/bin/cs fetch -p io.opentelemetry:opentelemetry-exporter-jaeger:1.6.0 io.grpc:grpc-netty:1.41.0)" org.openqa.selenium.grid.Main~g' /opt/bin/start-selenium-standalone.sh

# Enable OpenTelemetry
ENV JAVA_OPTS "$JAVA_OPTS \
  -Dotel.traces.exporter=jaeger \
  -Dotel.exporter.jaeger.endpoint=http://jaeger:14250 \
  -Dotel.resource.attributes=service.name=selenium-java-server"
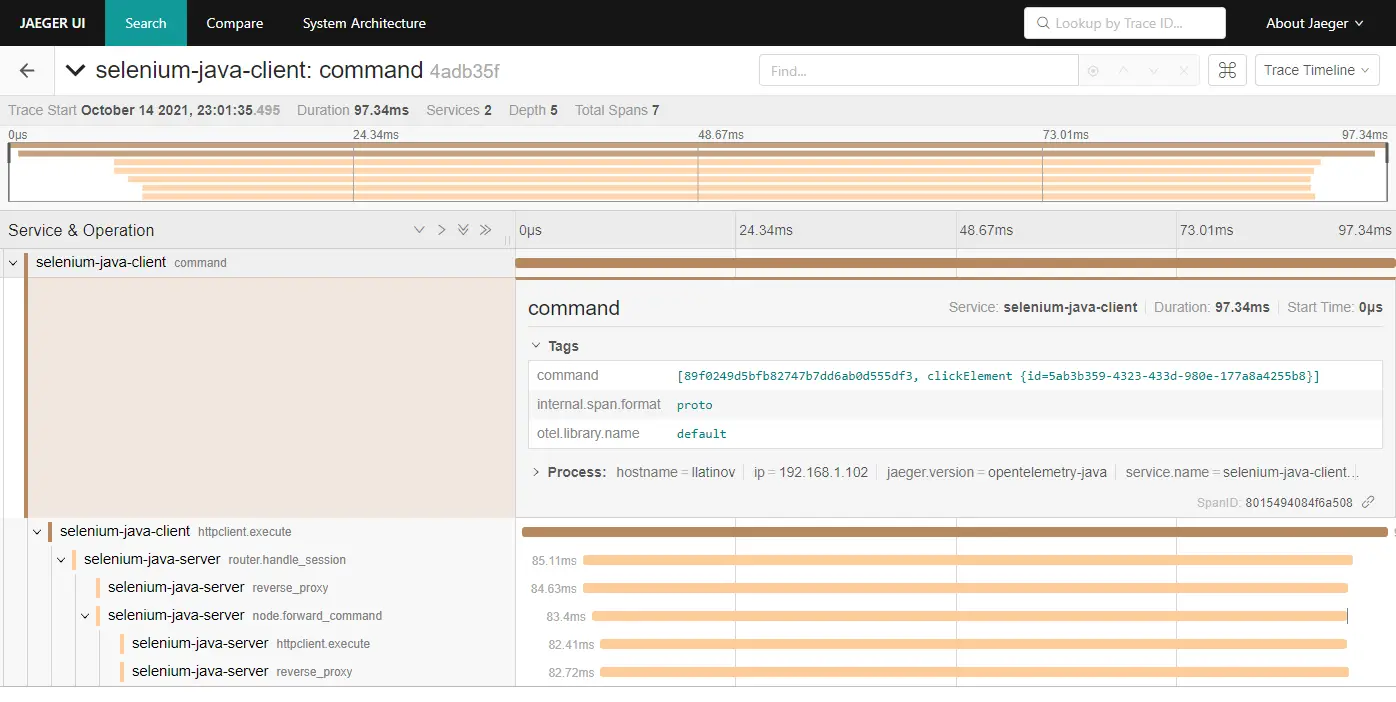
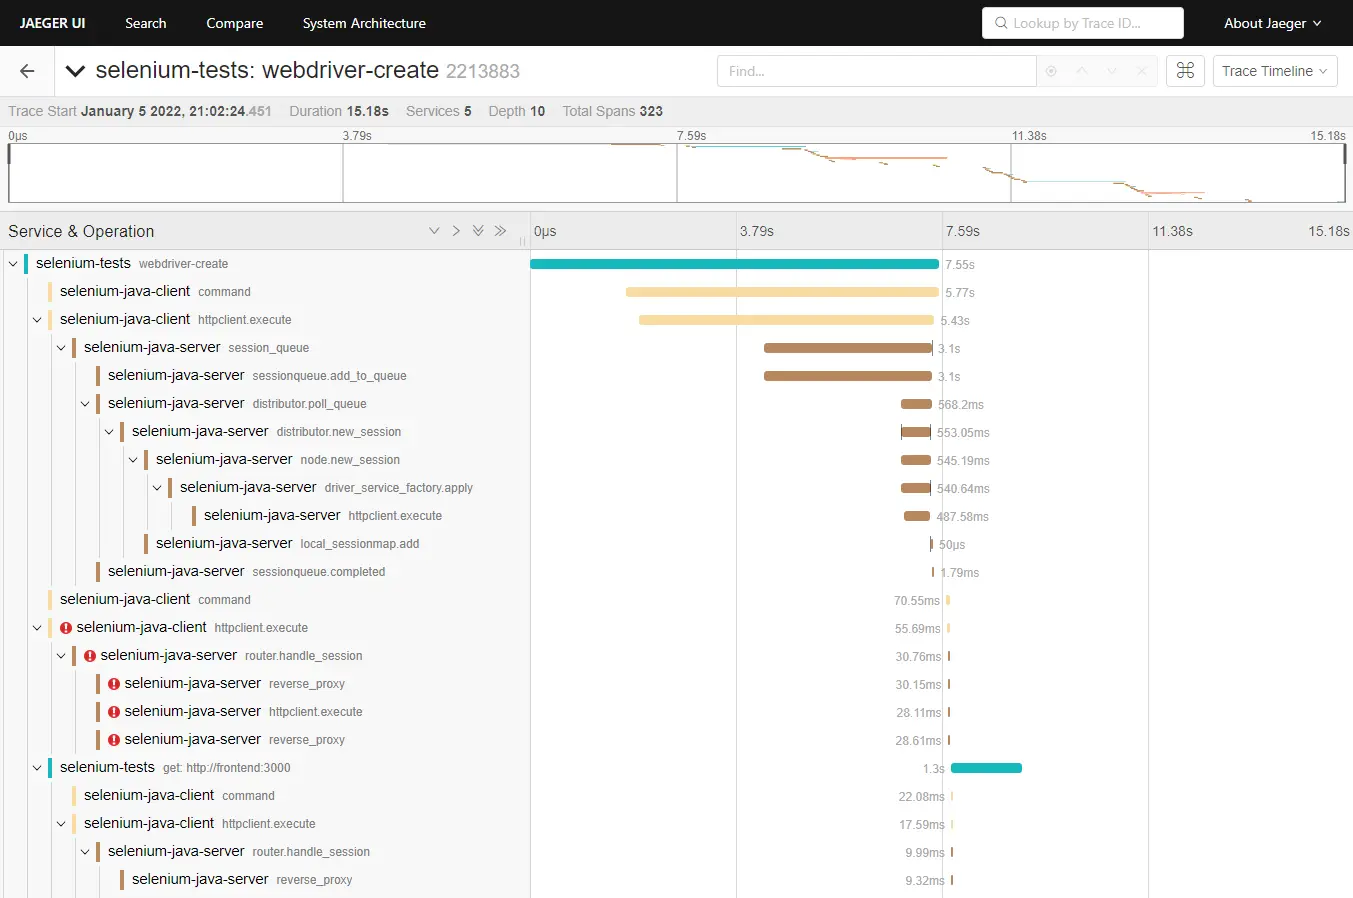
Selenium default traces in Jaeger
RemoteWebDriver client is passing down the traceparent header when making the request to the server, this is why both client and server traces are connected.
Selenium tests custom observability
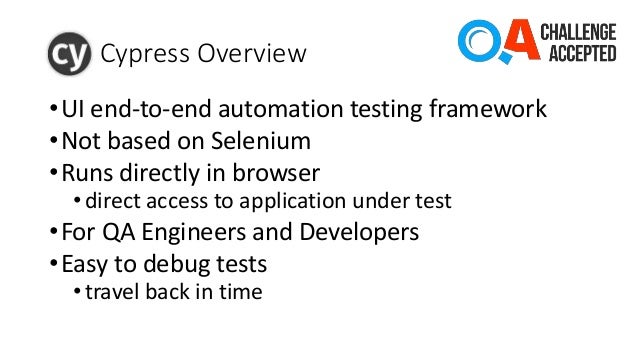
As stated before, in the case of HTTP calls, the OpenTelemetry binding between both parties is the traceparent header. I want to bind the Selenium tests with the frontend, so it comes naturally to mind – open the URL in the browser and provide this HTTP header. After research, I could not find a way to achieve this. I implemented a custom solution, which is WebDriver independent and can be customized as needed. Moreover, it is a web automation framework independent, this approach can be used with any web automation tool. An example of how tracing can be done with Cypress is shown in Distributed system observability: Instrument Cypress tests with OpenTelemetry post.
Instrument the frontend
In order to achieve linking, a JavaScript function is exposed in the frontend, which creates a parent Span. Then this JS function is called from the tests when needed. This function is named startBindingSpan() and is registered with the window global object. It creates a binding span with the same attributes (traceId, spanId, traceFlags) as the span used in the Selenium tests. This span never ends, so is not recorded in the traces. In order to enable this span, the traceSpan() function has to be manually used in the frontend code, because it links the current frontend context with the binding span. I have added another function, called flushTraces(). It forces the OpenTelemetry library to report the traces to Jaeger. Reporting is done with an HTTP call and the browser should not exit before all reporting requests are sent.
Note: some people consider exposing such a window-bound function in the frontend to modify React state as an anti-pattern. Frontend code is in src/helpers/tracing/index.ts:
declare const window: any
var bindingSpan: Span | undefined

window.startBindingSpan = (traceId: string, spanId: string, traceFlags: number) => {
  bindingSpan = webTracerWithZone.startSpan('')
  bindingSpan.spanContext().traceId = traceId
  bindingSpan.spanContext().spanId = spanId
  bindingSpan.spanContext().traceFlags = traceFlags
}

window.flushTraces = () => {
  provider.activeSpanProcessor.forceFlush().then(() => console.log('flushed'))
}

export function traceSpan<F extends (...args: any)
    => ReturnType<F>>(name: string, func: F): ReturnType<F> {
  var singleSpan: Span
  if (bindingSpan) {
    const ctx = trace.setSpan(context.active(), bindingSpan)
    singleSpan = webTracerWithZone.startSpan(name, undefined, ctx)
    bindingSpan = undefined
  } else {
    singleSpan = webTracerWithZone.startSpan(name)
  }
  return context.with(trace.setSpan(context.active(), singleSpan), () => {
    try {
      const result = func()
      singleSpan.end()
      return result
    } catch (error) {
      singleSpan.setStatus({ code: SpanStatusCode.ERROR })
      singleSpan.end()
      throw error
    }
  })
}
Instrument the Selenium tests
I have created a custom TracingWebDriver wrapper over the WebDriver. It instantiates the OpenTracing client with initializeTracer() method. It has a built-in custom logic when to generate a tracking span, which is the parent of this span, and when to link the tests’ span with the frontend span. Finding an element is done with the custom findElement() method. It creates a child span, linking it to the previously defined currentSpan. Then the window.startBindingSpan() function is being called in the browser in order to create the binding span in the frontend. This is the way to link tests and the frontend. In case of error, Span is recorded as an error and this can be tracked in Jaeger. On driver quit, or on URL change, or maybe on page change via a button, or whenever needed, window.flushTraces() function can be called by invoking forceFlushTraces() method in the tests. This has 1 second of Thread.sleep(), which waits for the tracing request to be fired from the frontend to the Jaeger. Sleeping like this is an anti-pattern for test automation, but I could not find a better way to wait for the traces. If the browser is prematurely closed or the page is navigated, then tracing is incorrect.
package com.automationrhapsody.observability;

import io.opentelemetry.api.trace.Span;
import io.opentelemetry.api.trace.StatusCode;
import io.opentelemetry.api.trace.Tracer;
import io.opentelemetry.context.Context;
import io.opentelemetry.exporter.jaeger.JaegerGrpcSpanExporter;
import io.opentelemetry.sdk.OpenTelemetrySdk;
import io.opentelemetry.sdk.resources.Resource;
import io.opentelemetry.sdk.trace.SdkTracerProvider;
import io.opentelemetry.sdk.trace.export.SimpleSpanProcessor;
import org.openqa.selenium.*;
import org.openqa.selenium.remote.tracing.opentelemetry.OpenTelemetryTracer;
import org.openqa.selenium.support.ui.ExpectedConditions;
import org.openqa.selenium.support.ui.WebDriverWait;

import java.io.File;
import java.time.Duration;
import java.util.List;

public class TracingWebDriver {

    private static final Duration WAIT_SECONDS = Duration.ofSeconds(5);
    private static final String JAEGER_GRPC_URL = "http://localhost:14250";

    private WebDriver driver;
    private Tracer tracer;
    private Span mainSpan;
    private Span currentSpan;

    public TracingWebDriver(boolean isRemote, String className, String methodName) {
        System.setProperty("otel.traces.exporter", "jaeger");
        System.setProperty("otel.exporter.jaeger.endpoint", JAEGER_GRPC_URL);
        System.setProperty("otel.resource.attributes", "service.name=selenium-java-client");
        System.setProperty("otel.metrics.exporter", "none");

        initializeTracer();

        mainSpan = tracer.spanBuilder("webdriver-create").startSpan();
        mainSpan.setAttribute("test.class.name", className);
        mainSpan.setAttribute("test.method.name", methodName);
        setCurrentSpan(mainSpan);
        driver = WebDriverFactory.createDriver(isRemote);
        mainSpan.end();
    }

    public void get(String url) {
        waitToLoad();
        setCurrentSpan(mainSpan);
        Span span = createChildSpan("get: " + url);
        try {
            forceFlushTraces();
            driver.get(url);
            createBrowserBindingSpan(span);
        } catch (Exception ex) {
            span.setStatus(StatusCode.ERROR, ex.getMessage());
            captureScreenshot();
        } finally {
            span.end();
        }
    }

    public WebElement findElement(By by) {
        waitToLoad();
        Span span = createChildSpan("findElement: " + by.toString());
        try {
            createBrowserBindingSpan(span);
            WebDriverWait wait = new WebDriverWait(driver, WAIT_SECONDS);
            return wait.until(ExpectedConditions.visibilityOfElementLocated(by));
        } catch (Exception ex) {
            span.setStatus(StatusCode.ERROR, ex.getMessage());
            captureScreenshot();
            return null;
        } finally {
            span.end();
        }
    }

    public void quit() {
        waitToLoad();
        forceFlushTraces();
        setCurrentSpan(mainSpan);
        Span span = createChildSpan("quit");
        driver.quit();
        span.end();
    }

    public Object executeJavaScript(String script) {
        return ((JavascriptExecutor) driver).executeScript(script);
    }

    public String captureScreenshot() {
        File screenshotFile = ((TakesScreenshot) driver).getScreenshotAs(OutputType.FILE);
        String output = screenshotFile.getAbsolutePath();
        System.out.println(output);
        return output;
    }

    private void waitToLoad() {
        WebDriverWait wait = new WebDriverWait(driver, WAIT_SECONDS);
        wait.until(ExpectedConditions.invisibilityOfElementLocated(By.id("test-progress-indicator")));
    }

    private void initializeTracer() {
        JaegerGrpcSpanExporter exporter = JaegerGrpcSpanExporter.builder().setEndpoint(JAEGER_GRPC_URL).build();
        Resource resource = Resource.builder()
                .put("service.name", "selenium-tests")
                .build();
        SdkTracerProvider provider = SdkTracerProvider.builder()
                .addSpanProcessor(SimpleSpanProcessor.create(exporter))
                .setResource(resource)
                .build();
        OpenTelemetrySdk openTelemetrySdk = OpenTelemetrySdk.builder()
                .setTracerProvider(provider)
                .build();
        tracer = openTelemetrySdk.getTracer("io.opentelemetry.jaeger.exporter");
    }

    private Span createChildSpan(String name) {
        Span span = tracer.spanBuilder(name)
                .setParent(Context.current().with(currentSpan))
                .startSpan();
        setCurrentSpan(span);
        return span;
    }

    private void setCurrentSpan(Span span) {
        currentSpan = span;
        OpenTelemetryTracer.getInstance().setOpenTelemetryContext(Context.current().with(span));
    }

    private void createBrowserBindingSpan(Span span) {
        executeJavaScript("window.startBindingSpan('"
                + span.getSpanContext().getTraceId() + "', '"
                + span.getSpanContext().getSpanId() + "', '"
                + span.getSpanContext().getTraceFlags().asHex() + "')");
    }

    private void forceFlushTraces() {
        executeJavaScript("if (window.flushTraces) window.flushTraces()");
        try {
            Thread.sleep(1000);
        } catch (InterruptedException e) {
            // Do nothing
        }
    }
}
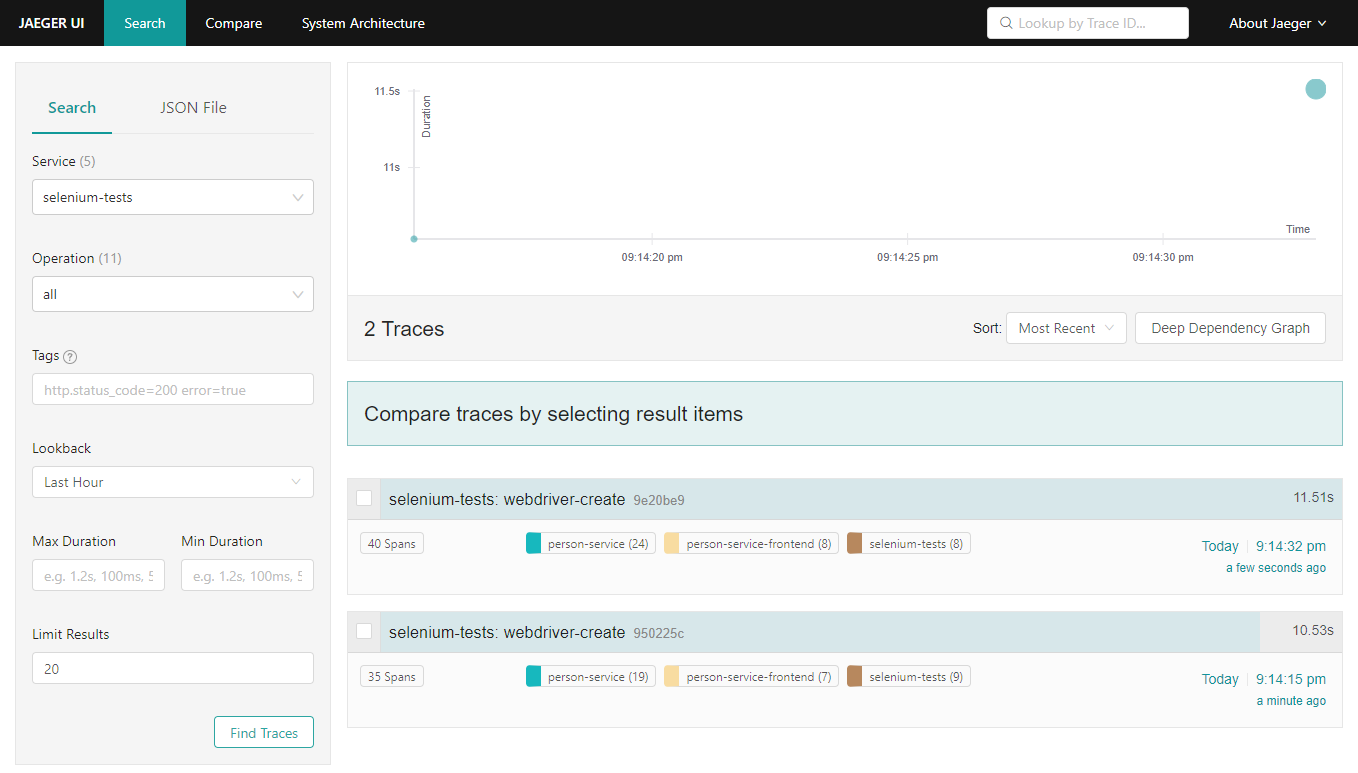
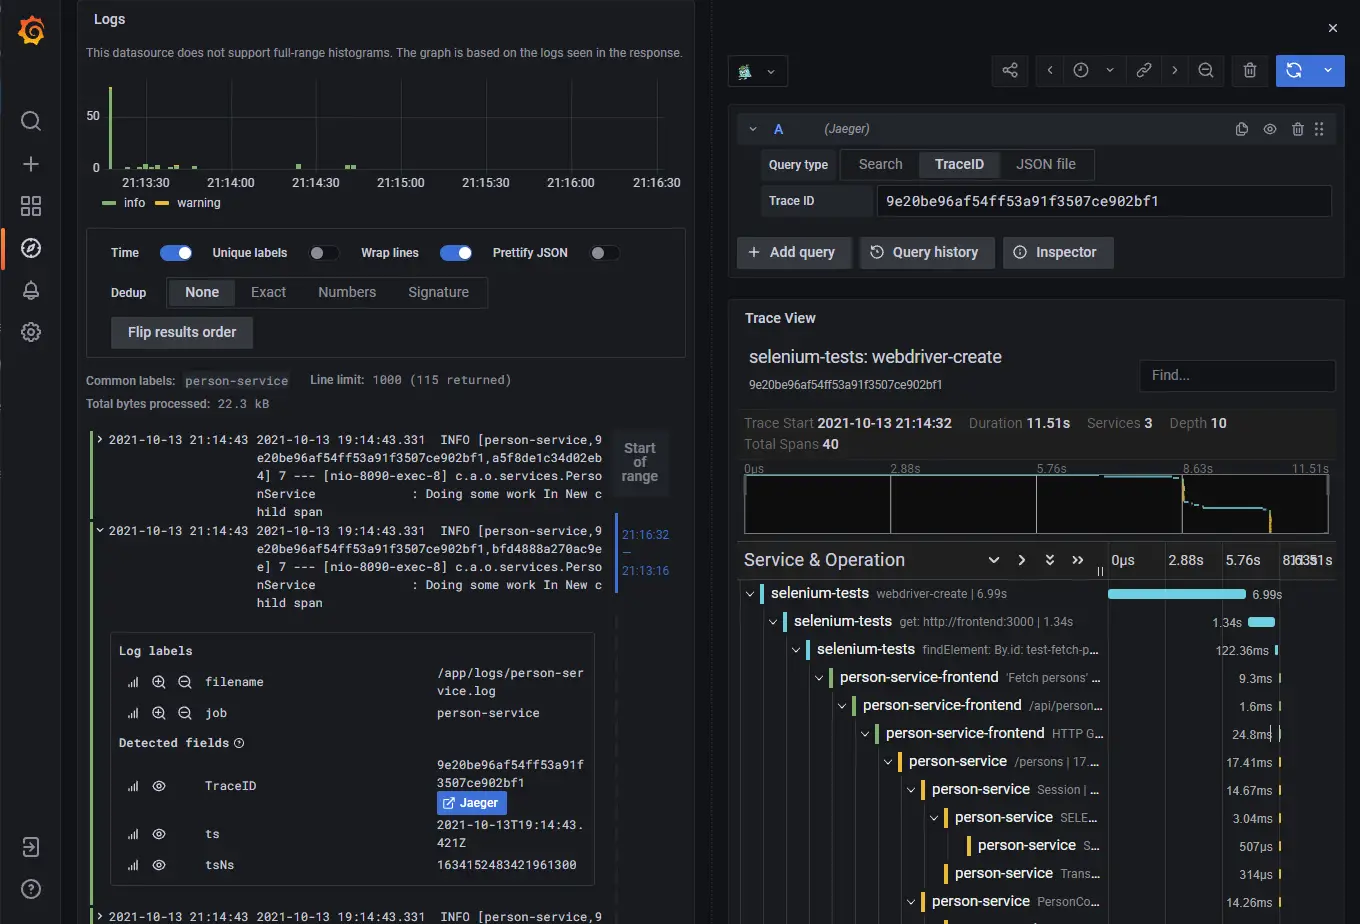
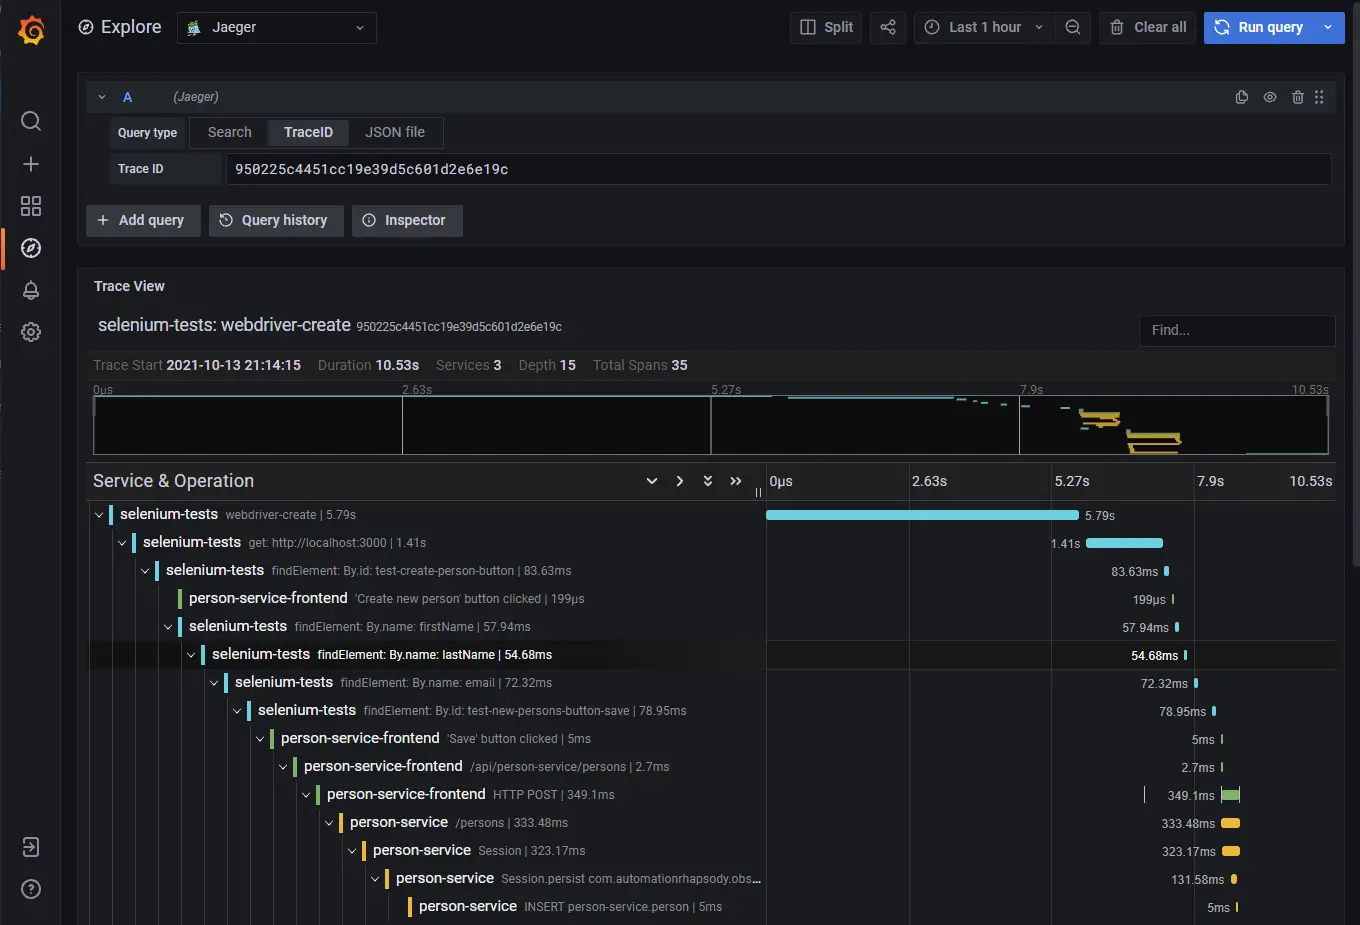
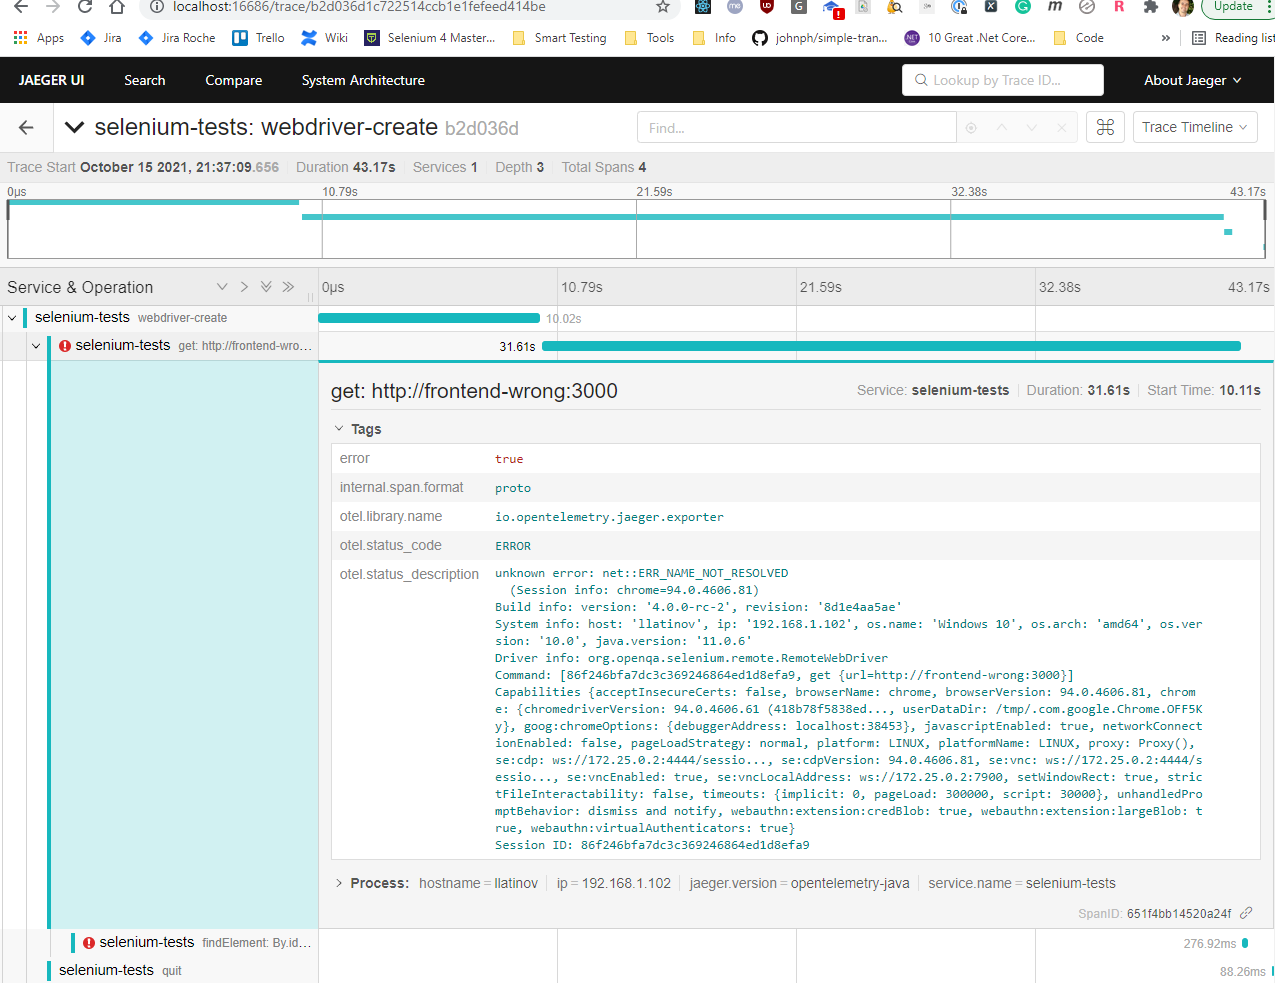
End-to-end traces in Jaeger

In case of error, this is also recorded.
Linking default and custom traces
In an ideal world, I would like to make my custom Span parent of the default Selenium tracing spans, so I can attach the debug information to the custom tracing information. I was not able to do this. I have raised an issue with Selenium, OpenTelementry tracing: be able to link the default tracing with a custom tracing. I contributed to Selenium by adding this possibility to link Selenium traces to the custom traces. This is done with the following code OpenTelemetryTracer.getInstance().setOpenTelemetryContext(Context.current().with(span)). Finally, the full tracing looks as shown on the image:
Conclusion
The out-of-the-box Selenium observability is useful to trace what is happening in a complex grid. It does not give the possibility to trace tests performance and how test steps are affecting the application itself. In the current post, I have described a way to create a custom tracing, which provides end-to-end traceability from the tests down to the database calls. This approach gives the flexibility to be customized for different needs. It involves changes in the application’s frontend code though, which involves the application architecture topic in the discussions.